
From Gerd Kommer and Jakob Riemensperger
Six months ago, at the beginning of August 2024, the global stock market fell by an astonishing eight percent in just three days, and the Japanese stock market, which had been the source of the downward pressure, even fell by 17%. [1] At that time, quite a few market participants expected the beginning of a long-term stock market downturn or even a crash.
The Handelsblatt, on the other hand - laudable in our opinion - published an article during the downturn on August 7, 2024 with the headline "The price correction offers one thing above all - buying opportunities" (Link here). So the newspaper did not do what is often done in such situations in the media and on the Internet, namely “get out of the market now quickly” activism and spread panic. (From August 8th, the global stock market began to recover little by little and at the end of 2024 was around 17% above the low of August 7th, 2024.)
Reacting to significant price declines in the stock market with subsequent purchases, as Handelsblatt recommended at the time, is a core element of “countercyclical investing”. Countercyclical investing comes in many forms. An English-language term that has recently become increasingly common in German-speaking countries is “Buy the Dip.” [2]. Other terms and keywords for countercyclical strategies are: “Contrarian Investing”, “Buy when the guns are roaring”, “Turning setbacks into opportunities”, “Using market corrections to buy again”, “Buying when there is blood in the streets”, [3] “Take advantage of the bargain period in the stock market”, “see the sell-off as an opportunity” and “invest against the trend”.
In this blog post we want to show that and why countercyclical investing in the form of buy the dip (“BTD”) works worse than many believe.
The structure and process of Buy the Dip
In its simplest form, BTD means that the investor's overall portfolio initially consists of a stock investment of e.g. B. 75% of the total portfolio and an investment reserve (“IR”) of, for example, 25%. [4] The IR is held in “cash”, i.e. a low-risk, liquid investment, for example an interest-bearing overnight money or a money market fund investment (more on money market funds here). After there has been a significant downturn (price collapse) in the stock market, the investor uses the IR to reinvest (hence “buy the dip”) in the stock market and now has a 100% stock portfolio.
To simplify again, there are only two basic forms of BTD: (a) the rule-based variant and (b) the “opportunistic” or “tactical” variant without fixed rules. The latter is likely to be more widespread among do-it-yourself private investors. Here the investor decides purely depending on the situation and subjectively when and how much to reinvest in the downturn.
In the rule-based variant, on the other hand, there is a fixed quantitative criterion (an algorithm) that specifies when and to what extent re-investing occurs in the downturn.
In this blog post we analyze a rule-based BTD variant. The basic investment should be a diversified investment in a global stock index ETF – the proverbial “investment in the world AG”. In addition to the form of the basic investment, the following two parameters must be specified for rule-based BTD:
(a) The triggering trading signal for the follow-up purchase. This could be, for example, a 15% drop in the relevant stock index. We call this the “drawdown limit” (“DG”). [5]
(b) The percentage of the total portfolio initially reserved for the IR and the specific asset type in which the IR is to be held. In the standard case, as mentioned, IR consists of a low-risk, interest-bearing money market investment.
If the BTD strategy is more differentiated, (c) the trading signal for the partial “re-exit” from the stock market would have to be determined in order to rebuild the IR if the market appears to be recovering sustainably again. However, such an “exit formula” is not required for a fundamental analysis of the performance of a BTD strategy, as we will explain below.
The investment logic behind Buy the Dip
To put it bluntly, the BTD strategy is based on the “bargain theory of the stock market”. This is the (basically correct) idea that, all other things being equal, stocks after a significant price decline will increase relative to the time immediately before the price decline expected return i.e. a statistically particularly attractive return in the future. Behind this is the equally correct assumption that a price decline is in the majority of cases stronger than the parallel deterioration fundamental Share value, which is derived from the company's real economic prospects.
The BTD bargain theory could be described more academically as follows: The so-called capital costs of companies rise in a market crisis. The cost of capital of companies is the returns of their capital providers (the investors). Capital costs are divided into debt capital costs (the interest rate on loans or bonds) and equity costs. When it comes to debt capital, the mechanism of increased capital costs is immediately obvious to most investors. [6] In the case of equity, however, the increase in the cost of capital is less generally known.
It works like this: the lower a company's share price is, the more new shares it has to issue in order to raise a given amount of fresh equity capital and the more the existing shareholders are "diluted", i.e. the more "claim rights to future company earnings" (shares) the existing shareholders have to give up to the new shareholders in percentage terms as part of a new issue of shares. A falling share price makes equity financing more expensive.
A smart investor, according to BTD thinking, invests more in stocks, i.e. increases his share quota, after the company's cost of capital (the cost of equity) has risen in a market downturn.
The “bargain theory” can be confirmed empirically. This is done in simple form in Table 1. It shows the inflation-adjusted (real) returns of the global stock market over the past five and a half decades since the beginning of 1970 for three different periods following a market decline of 25% or more in real terms. The calculation in Table 1 is based on the MSCI World Index in euros. It produced an inflation-adjusted (real) average return of 5.6% p.a. over these 55 years.
Table 1: Illustration of the statistically increased returns after a 25% price drop in the global stock market (MSCI World Index) - period 1970 to 2024 (55 years)
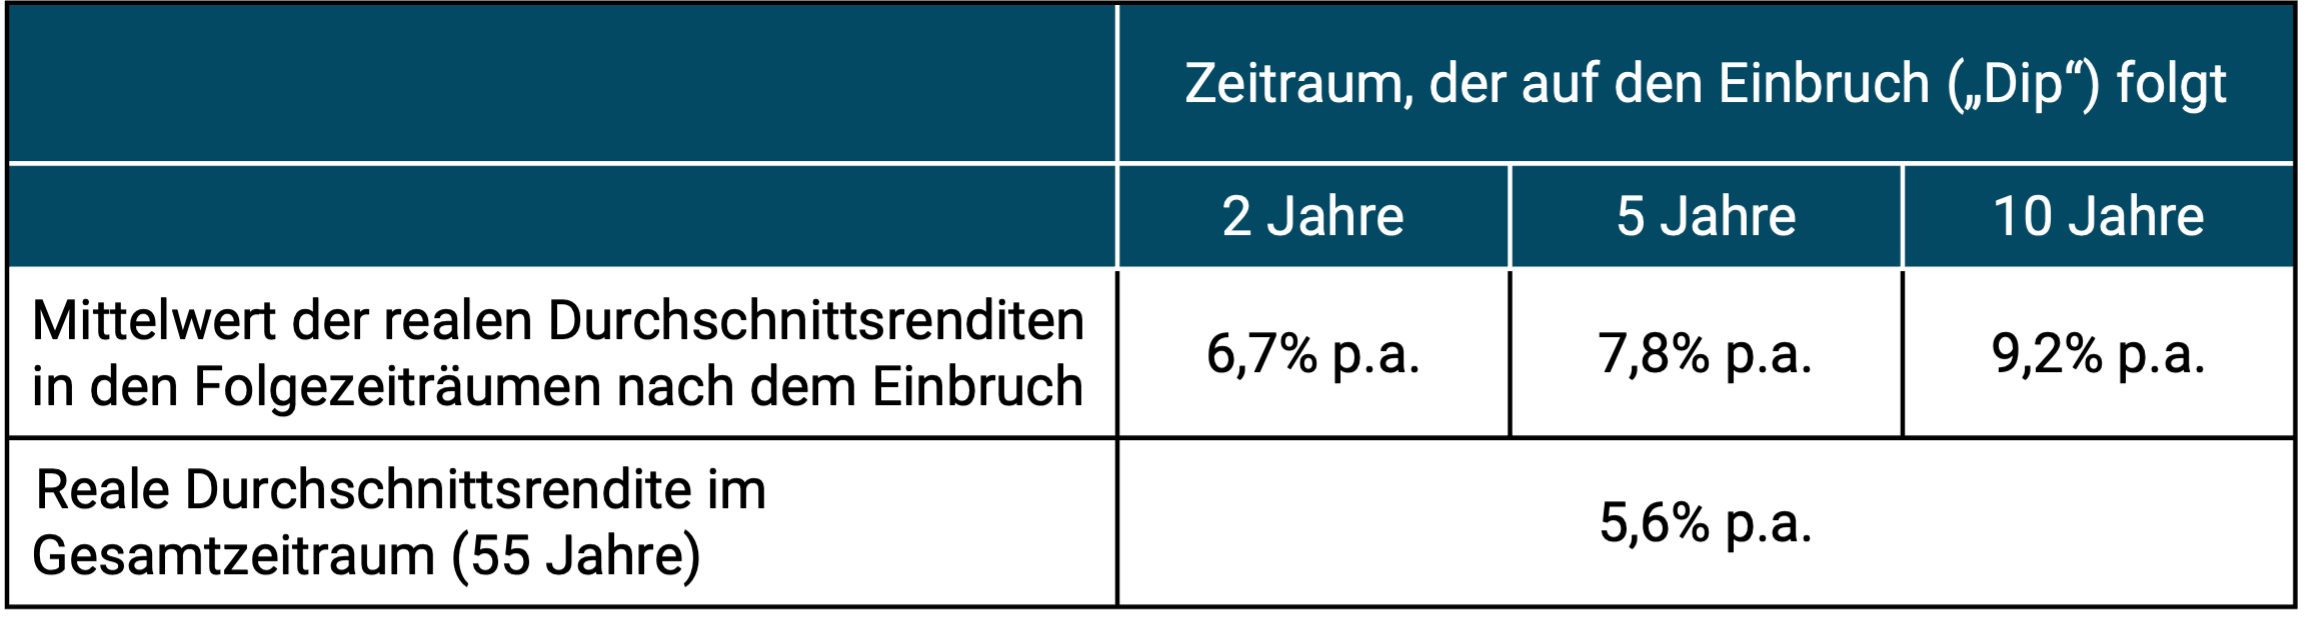
► In DM or Euro, adjusted for inflation, without costs and taxes. ► Total returns including dividends are shown. ► Data: MSCI.
However, the numbers in Table 1 demonstrate the advantages of a BTD strategy relative to obvious alternatives not – although one might quickly conclude that incorrectly. We'll show below why they don't prove it. Obvious alternatives would be, for example: B. an “immediate all-in buy-and-hold strategy” (SAI B&H) [7] with a fixed 100% equity allocation or possibly mixed asset allocations of 90/10 or 80/20 on a buy-and-hold basis supplemented by rule-based rebalancing (for rebalancing see here and here).
Rules-based (algorithmic) rebalancing is – just like Buy the Dip – countercyclical investing based on the principle “Sell what went particularly well and buy what went particularly badly” or “Sell high, buy low”.
Our Buy the Dip Backtest
In order to test BTD's historical performance in a truly meaningful way, we have the following backtest [8] made: Our basic investment is again the MSCI World stock index. We look at the nominal daily returns of the index in euros and evaluate several simple BTD algorithms for 14 different (overlapping) time periods from 2007 to the present. For the sake of simplicity, we ignore costs and taxes.
Table 2 summarizes the return effect from the combinations for two different drawdown limits and three different investment reserves. The table shows the average excess return of SAI B&H compared to BTD in 14 overlapping evaluation periods. The first, longest evaluation period lasts from 2007 to 2024 (18 years), the last, shortest from 2020 to 2024 (5 years).
In terms of IR, the nominal money market return in Germany averaged around 0.8% p.a. before tax in the historical period from 2007 to 2024 (measured against a typical money market fund ETF). Since this value is only moderately above zero, we set the return on IR in our backtest at zero for the sake of simplicity - an assumption that slightly works against BTD in the backtest. It should be noted, however, that in return we have not deducted any costs for the work involved in implementing the active BTD strategy or the increased tax burden for BTD - if it is not carried out within a UCITS fund shell (investment fund). [9]
Table 2: Average excess return of the immediate all-in buy-and-hold strategy compared to different buy-the-dip strategies in 15 different time windows from 2007 to 2024
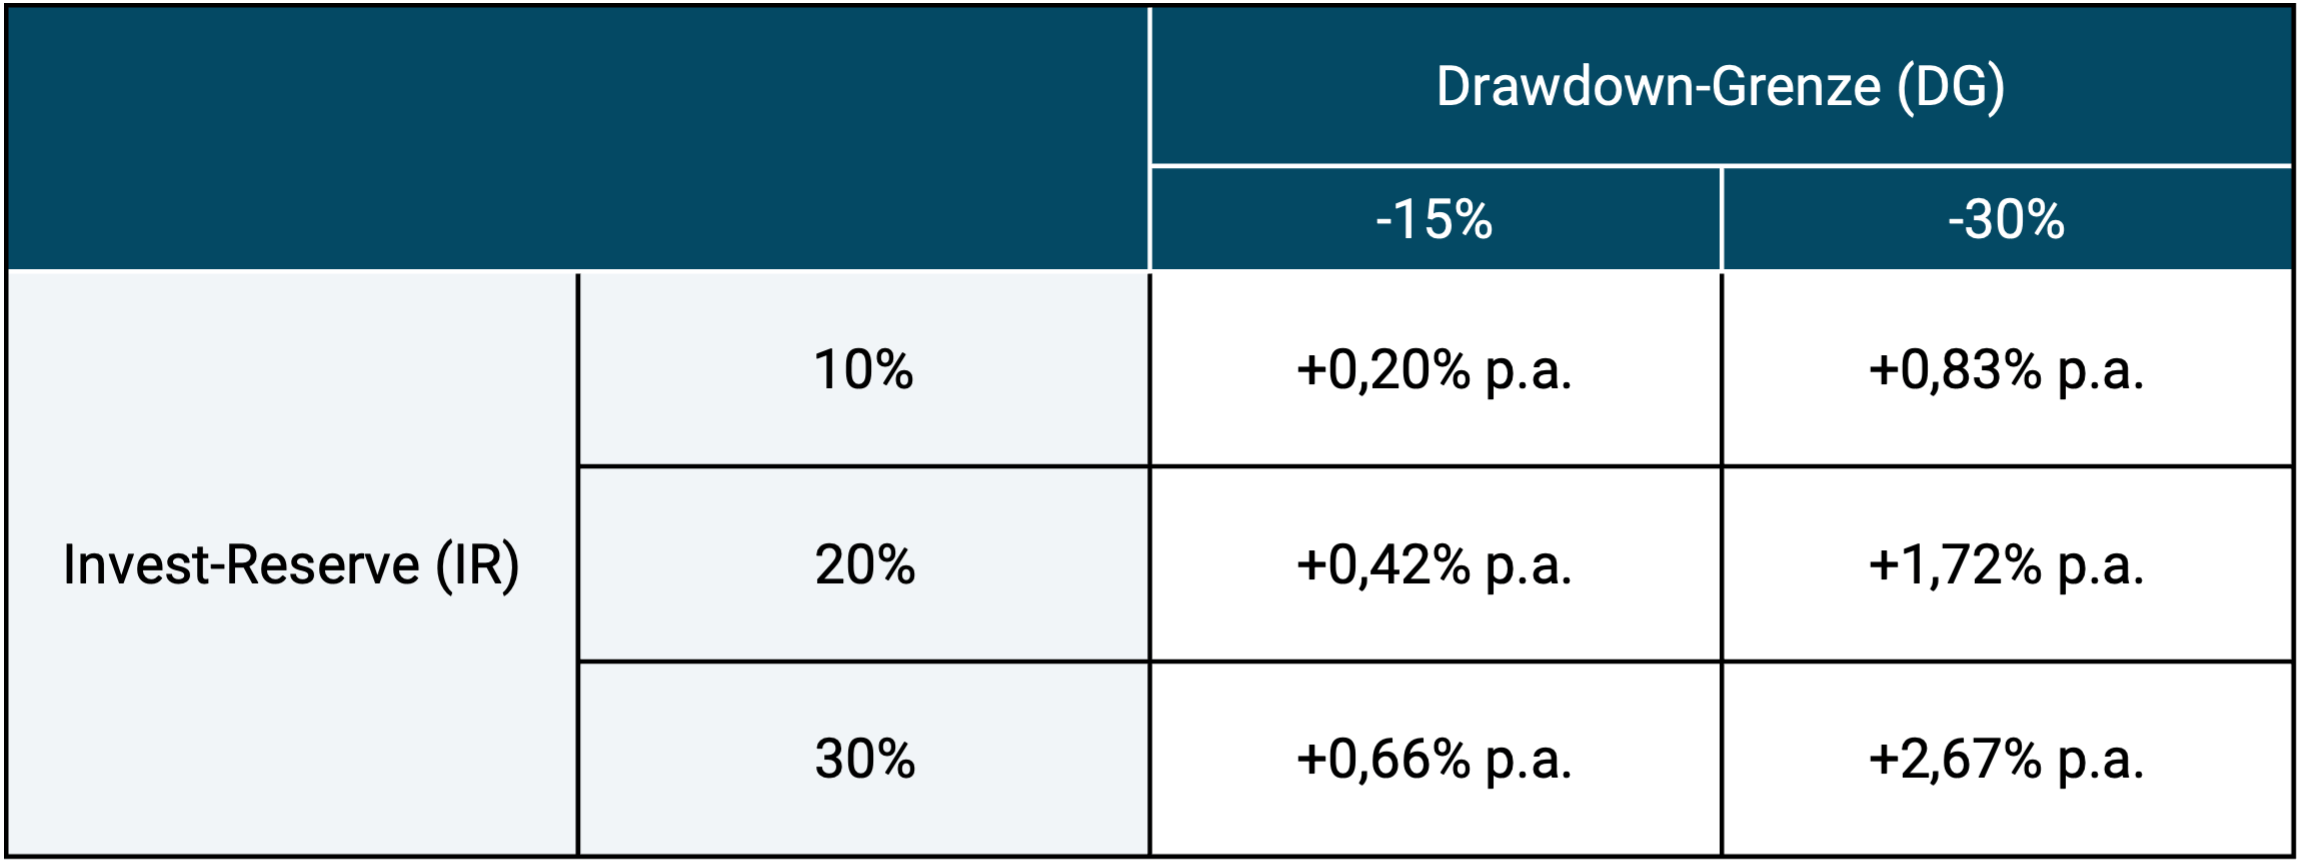
► Investment reserve = Initial percentage share of the overall portfolio. ► Returns in euros, excluding costs and taxes. ► Underlying basic investment MSCI World index. ► For further explanations see current text. ► Data: MSCI, Federal Statistical Office.
What is the risk side?
For reasons of space and simplicity, we have not discussed risk in Table 2. With regard to the two risk indicators volatility (standard deviation of daily or monthly returns) and maximum drawdown (maximum cumulative loss), the respective BTD variant produces advantages, primarily because on average less than 100% of the total investment is invested in the risky asset class of stocks. However, the risk advantage in most IR-DG combinations over the 15 evaluation periods is less great than one would intuitively assume. An example: For the 18-year period with an investment reserve of 20% and a drawdown limit of minus 20%, the volatility for BTD and SAI B&H was almost identical. There was also no big BTD advantage in the maximum drawdown (minus 49% for BTD versus minus 53% for SAI B&H).
Why didn't we formulate and calculate an exit sail in our backtest, even though this would normally be part of an algorithmic BTD strategy? Two reasons: (a) By calculating 15 time windows, each starting one year later and all extending to the present, we indirectly approximated a BTD strategy with a re-exit rule. (b) The omission of a re-exit rule significantly limited our computational effort and simplified the presentation of the results in this text.
What if you evaluated a longer period of time?
Ultimately, the specific results of an empirical comparison of BTD with SAI B&H depend considerably on which specific historical period is being evaluated. This is particularly true for time frames of less than around 30 years.
We have a much longer historical time window in our thematically related blog post “Waiting for a cheaper stock market – does it work?” analyzed from March 2019 – see here. In it, we examined another BTD strategy (which we casually called “crash timing”) for the longer period from 1970 to 2018 (49 years) based on monthly returns from the MSCI World Index. The return results for BTD were similar to those in the shorter and conceptually slightly different calculation based on daily returns presented here.
Why the buy the dip return results disappoint
Any BTD evaluation - unless it is intended to be misleading - must consider the opportunity cost of holding a low-yielding IR relative to a SAI B&H strategy (opportunity cost = lost return/lost benefit). On average, the opportunity costs of IR are higher than the benefit from the increased return of the dip investment after the buy signal is triggered. In other words: Due to the information efficiency of the stock market, the expected returns after a strong downturn do not rise on average enough to sufficiently compensate for the previously wasted returns from the IR. Or to put it another way: In the long term, the global stock market has too strong an upward trend and too high a return relative to low-risk cash investments. In addition, stock market declines are overall not severe enough and/or not spread evenly enough along the timeline for BTD to generate sustained excess returns.
While it's true that the average company's cost of capital statistically increases after a market downturn, and therefore stock returns tend to increase afterwards, that's still not a good enough reason for BTD to work. This "shortened" cost of capital theory does not contain the statement that the cost of equity capital of companies (and thus the returns of stock investors) is statistically higher than the return on interest-bearing money market investments, the typical and appropriate form of investment for IR, even before the crisis (before the collapse). From the correct statement that “a company's cost of capital increases in a downturn,” one can only correctly conclude that it is statistically detrimental to returns to sell investments in a downturn. So it's an argument for buy-and-hold, not market timing.
Of course it is possible for a given historical period in the data by so-called Overfitting to identify a specific combination of IR and DG that has historically produced significant outperformance. However, this type of “data mining” or “data snooping” does not help us to identify a BTD strategy that will be profitable in the future and represents an ethically dubious approach. [10]
Overfitting is the main reason why BTD backtests appear to produce attractive returns in non-scientific publications.
A second, more banal reason for the many “BTD miracles” in advice books, print articles and finfluencers is that only the returns are concerned without IR after the dip - as in Table 1 of this blog post.
Wouldn't the BTD strategy tested here have to be combined with e.g. B. benchmark with an 80/20 asset allocation (stocks/money market)?
Yes, and no. In our opinion, the primary goal of most BTD investors is to exceed the returns of a corresponding SAI B&H alternative, i.e. to beat a passive 100% equity strategy. In our opinion, the primary goal of BTD investors is not to achieve a significant risk reduction compared to a 100% equity investment with a lower return.
Either way, it is possible to consider returns and Risk also requires a comprehensive, objective assessment when comparing BTD with SAI B&H.
The results of our backtest in this blog post and in our March 2019 blog post do not indicate that BTD's return disadvantage relative to SAI B&H is offset by a sufficiently large risk advantage. In our opinion, the same conclusion emerges from an evaluation of scientific studies that we have found on BTD and comparable contrarian market timing approaches.
What does the academic literature say about Buy the Dip?
We found two recent academic studies that evaluate specific BTD strategies using different data sets and different methodological approaches: Park 2022 (here) and Bonini et al. (2024) (here). Both come to the conclusion that BTD is beaten by corresponding immediate all-in buy-and-hold strategies in terms of the investment goal of total return or maximization of final assets. Yes, BTD has a risk advantage over SAI B&H, but it seems rather limited.
Overall, the results in the scientific literature do not appear to be any better for other countercyclical market timing strategies that do not explicitly call themselves “buy the dip”. We mention some such studies at the end of this blog post.
What about a non-rule-bound, purely opportunistic BTD strategy?
Ultimately, most actively managed mixed funds are likely to use opportunistic (tactical) BTD market timing at least temporarily in line with the goal of active investing Buy low, sell high operate. This probably also applies to the largest and best-known German mixed fund Flossbach von Storch Multiple Opportunities (WKN A0M430). Its bond ratio (investment reserve) is usually less than 20% and can go to zero in the “bargain period” (during a dip). Over the ten years from January 2015 to December 2024, the FvS fund delivered a return of 5.4% p.a. compared to the return of an MSCI World ETF of 10.7% p.a.
The FvS fund's lower volatility risk did not offset its shortfall in returns over this ten-year period, as evidenced by the fact that the risk-weighted return in the form of the so-called Sharpe ratio for the MSCI World ETF was 1.8 times as high as that of the FvS fund.
The average mixed fund sold in Germany (“FWW sector average mixed fund flexible world”) [11] returned even worse than the FvS fund over the same period.
How does BTD perform when practiced with individual stocks as part of stock picking?
Naturally, we cannot answer this question with our back test. However, one can also argue here that most actively managed equity funds as well as actively managed do-it-yourself private investor portfolios practice BTD in different ways. We know from science that the vast majority of these portfolios underperform their passive alternative and the small minority of outperformers cannot be reliably predicted in the future because they probably came about largely by chance (luck).
What if you don't keep your investment reserve in cash, but rather in a supposedly or actually higher-yielding form of investment?
We also did not include this investment strategy in our analysis. From our perspective, this is not a buy the dip strategy as BTD is typically understood, but rather a different form of market timing, namely switching back and forth between two or more risky asset classes in order to achieve an attractive return-risk combination. The difference to “real” BTD is that no “risk-free” investment is used and therefore the opportunity cost argument is not decisive here in the same sense.
Conclusion
Buy the dip investing has in common with immediate all-in buy-and-hold investing (SAI B&H) the correct principle of countercyclical investing, which is derived from essential economic logic and from the evaluation of long data series.
We still think SAI B&H is superior. Although the statistical expected return on stocks does indeed increase after a price decline, this increase does not sufficiently compensate for the reduced return on the investment reserve necessary for BTD and the opportunity costs of IR.
In our opinion, the argument that BTD strategies have a lower risk than comparable SAI B&H strategies only partially puts the return disadvantage into perspective, as we have tried to show here.
The main reason for BTD's too good image in the private investor community is probably that many of its supporters only measure the returns of the subsequent investment (after the dip), but not the returns of the entire portfolio including the investment reserve before the dip.
Endnotes
[1] Information in euros. The supposed causes were unexpected increases in short-term key interest rates by the Japanese central bank and a simultaneous devaluation of the yen.
[2] “Dip” = as an English noun “falling off”, “immersion”, “lowering”.
[3] In the English original “Buy when there is blood in the streets”.
[4] In English financial jargon, IR is often referred to casually as “dry powder”.
[5] It is important that this slump or valuation indicator can be observed in real time on a daily basis. For example, using a market P/E ratio (price earnings ratio) as a valuation indicator would be problematic because daily P/E data is not available, at least for private investors.
[6] An increased interest rate that the company must pay on new borrowed capital.
[7] “Immediate All In Buy and Hold” here means “investing the entire portfolio in one sum in stocks from the start and then buying and holding”.
[8] “Backtest”: A return calculation based on historical market data.
[9] In our blog post we show why actively investing in stocks results in higher tax burdens than buy-and-hold “Save taxes through buy-and-hold” from October 2021.
[10] Overfitting/data mining means, out of ignorance or bad faith, using a computer to look for a purely random pattern in historical data that supports one's thesis, even though this pattern is probably not present in other historical or future data.
[11] See www.fondsweb.de.
literature
AQR (no author) (2018) “It Was the Worst of Times: Diversification During a Century of Drawdowns”; Alternative Thinking, 3Q18 – Sept. 26, 2018; Internet reference here
Bonini, Stefano/Thomas Shohfi/Majeed Simaan (2024): “Buy the Dip?”; In: European Financial Management; Volume 30; Issue 4; September 2024; Internet reference here
Dahle, James (2020): “What is Dry Powder?”; The White Coat Investor; 19 Oct. 2020; Internet reference here
Estrada, Javier (2015): “Multiples, Forecasting, and Asset Allocation”; in: Journal of Applied Corporate Finance; Summer 2015; Vol. 27, Issue 3
Felix, Ben (2023): “Cash is a terrible long-term investment, even at 5% interest”; YouTube video; Internet reference here
Ilmanen, Antti (2016): “A Historical Perspective on Time-Varying Expected Returns”; In: Financial Market History. Reflections on the Past for Investors Today; [Book] Edited by David Cambers and Elroy Dimson; CFA Institute Research Foundation
Kommer, Gerd/Maximilian Bartosch (2022): “Downside hedging – the holy grail of investing?”; blog post; July 2022; Internet reference here
Kommer, Gerd (2017): “The Legend of the Cost Averaging Effect”; blog post; July 2017; Internet reference here
Laarits, Toomas (2023): “Discounting Market Timing Strategies”; 05 Dec 2023; SSRN, Internet reference here
Park, Sangkyun (2022): “Stock Market Reaction to Recession and Buying the Dips”; In: The Journal of Investing; 31; No. 5; August 2022; Internet reference here
Sindreu, Jon (2024): “Stocks Are Crashing – That’s a Great Reason to Sit Tight”; Wall Street Journal, Aug 5, 2024; Internet reference here