Cost

Our remuneration and the associated costs of our asset management are designed in such a way that harmful conflicts of interest cannot arise, which is unfortunately the norm at many banks. This means that we do not use any in-house products and do not accept any commissions, commissions or “kickbacks” from financial product manufacturers. We also do not charge performance fees (profit-related fees) because they are expensive for clients in the long term, reduce returns and create risk-increasing false incentives for the manager. This focus on lower fees is critical because the cost of asset management has a significant long-term impact on the investor's final wealth and net return.

Our form of compensation is simple. It takes the form of an “assets under management fee”, i.e. a quarterly service fee depending on the assets under management in your portfolio. We do not quote our remuneration without VAT, as is the manipulative and customer-unfriendly practice in the financial industry, but including VAT. The amount of the fees incurred is therefore always transparent.

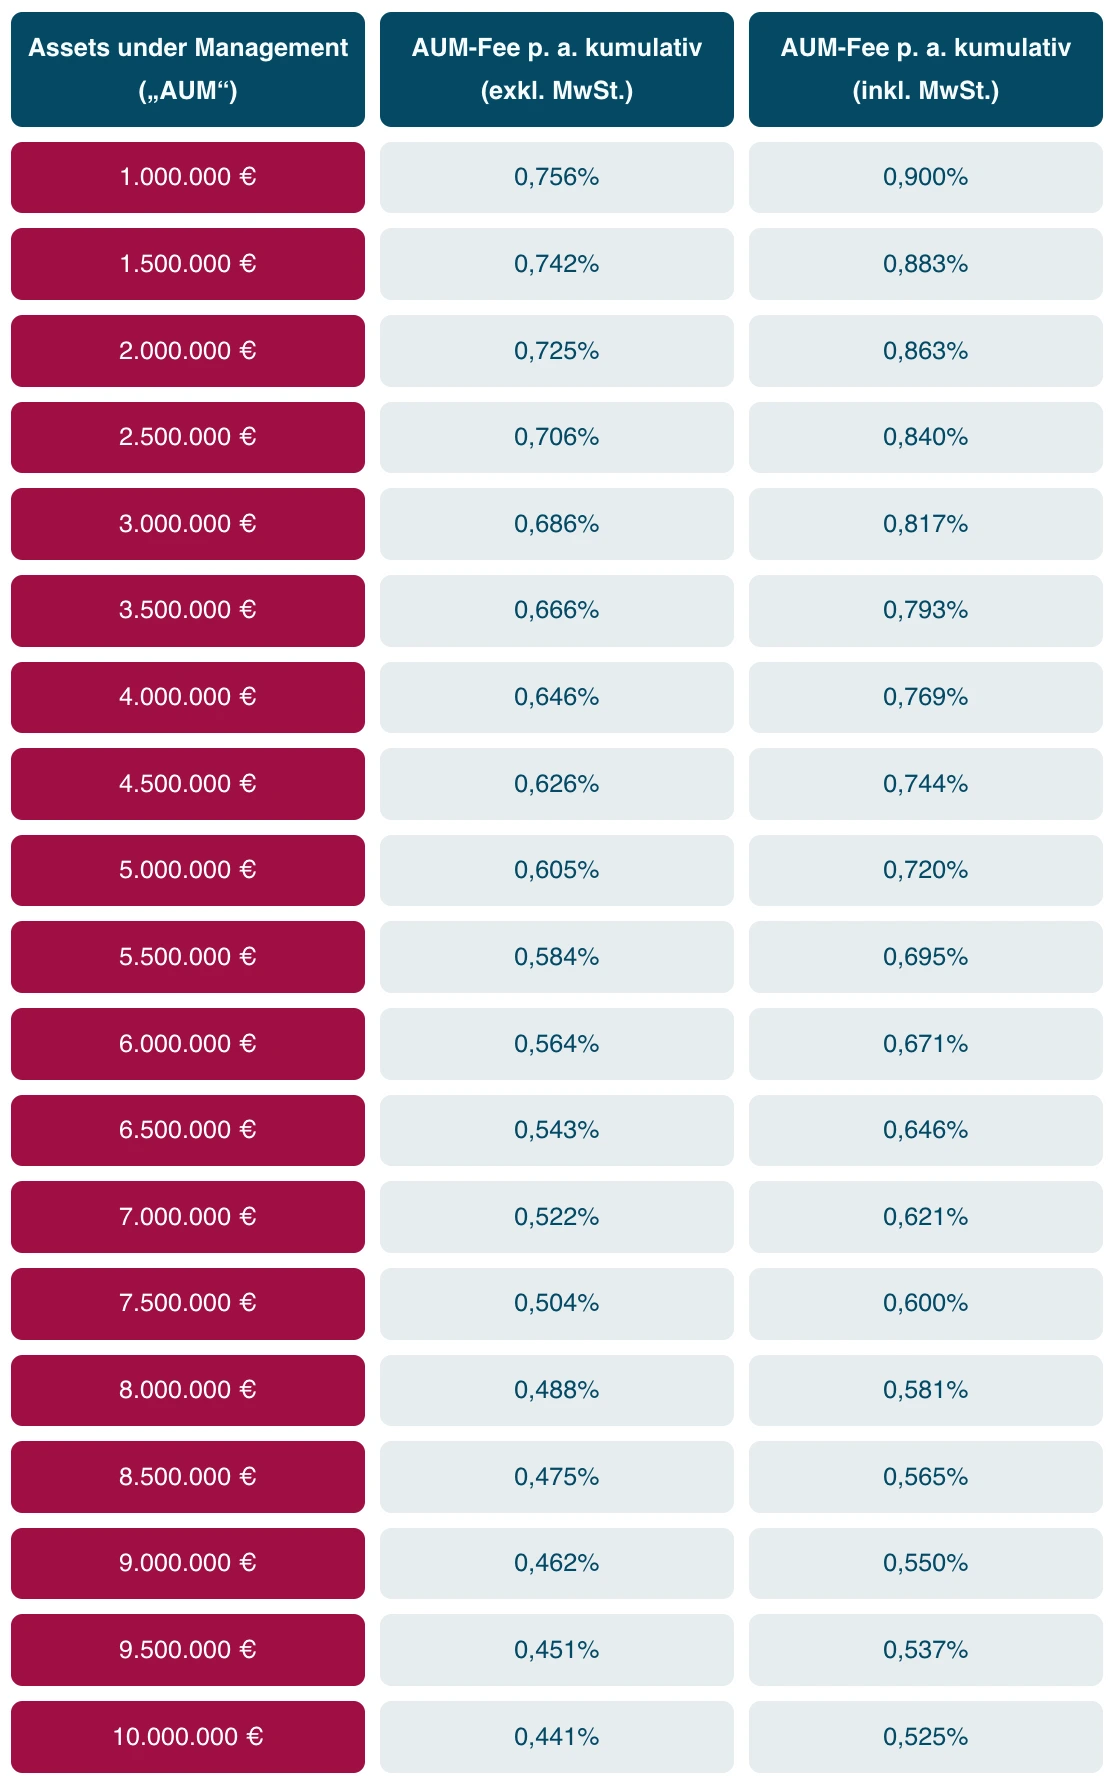
We support clients with an investment volume of one million euros or more and an assets under management fee of 0.900% (including VAT) per annum. This fee decreases in percentage terms with the amount of investment volume (discount scale) and drops to just 0.323% (including VAT) for very large assets. See the table for this further down on this page. Your assets are always managed according to a clear investment strategy.

Cost comparison with banks and conventional asset managers

Comparison of Gerd Kommer Invest's ongoing costs per year with typical asset managers.

The overall ongoing costs of asset management by us are typically around half of the costs of banks and “independent” asset managers.

With a portfolio volume of 4 million euros, our clients save around 59,600 euros annually compared to investors in conventional asset management. Assuming the same pre-cost return and tax burden, the cost advantage of our asset management leads to a final asset advantage of around 33% after 20 years and around 53% after 30 years.

Our asset management also includes comprehensive financial advice, both initially and on an ongoing basis. This financial advice is not billed separately.

Explanations of the graphic

All information including VAT ► Assumed portfolio volume (managed assets): 4 million euros. ► Assumed division of portfolio (asset allocation): 60/40 (stocks/bonds portfolio). ► Product costs: For a typical asset management mandate, it is assumed that 40% of the portfolio volume consists of funds and structured products; Two thirds of this 40% consist of equity products and one third interest products. The product costs at GKI refer to a portfolio without an overweighting of factor premiums. In a factor investing portfolio, the product costs are slightly higher. ► Transaction costs: For a typical asset management mandate, it is assumed that 60% of the portfolio volume consists of individual investments that are traded once a year. This results in average “round trip costs” (buy + sell) of 0.5% (this also includes “invisible” costs in the form of the bid-ask spread). 40% of the portfolio consists of funds and structured products that are traded every three years. This results in an average round trip cost of 1%. The transaction costs with GKI are significantly lower due to the buy-and-hold approach; transactions only occur during relatively rare rebalancing. ► Performance fee (profit sharing): The value shown is to be interpreted as a long-term average value, see also ours Blog post to performance fees. ► Depot costs: Depots in typical asset management mandates are charged at 0.1% to 0.2% p.a. a. priced. In the present case we conservatively calculate 0.1% p.a. a. With GKI, depending on the custodian bank, there are no or only low custody costs of 0.03%. ► Resulting GKI fee savings compared to typical asset managers p. a.: 59,600 EUR = 4,000,000 EUR x (2.50% – 1.01%).

Comparison of Gerd Kommer Invest's ongoing costs per year with typical asset managers.

Explanations of the graphic

All information including VAT ► Assumed portfolio volume (managed assets): 4 million euros. ► Assumed division of portfolio (asset allocation): 60/40 (stocks/bonds portfolio). ► Product costs: For a typical asset management mandate, it is assumed that 40% of the portfolio volume consists of funds and structured products; Two thirds of this 40% consist of equity products and one third interest products. The product costs at GKI refer to a market-neutral portfolio. In a factor investing portfolio, the product costs are slightly higher. ► Transaction costs: For a typical asset management mandate, it is assumed that 60% of the portfolio volume consists of individual investments that are traded once a year. This results in average “round trip costs” (buy + sell) of 0.5% (this also includes “invisible” costs in the form of the bid-ask spread). 40% of the portfolio consists of funds and structured products that are traded every three years. This results in an average round trip cost of 1%. The transaction costs with GKI are significantly lower due to the buy-and-hold approach; transactions only occur during relatively rare rebalancing. ► Performance fee (profit sharing): The value shown is to be interpreted as a long-term average value, see also ours Blog post to performance fees. ► Depot costs: Depots in typical asset management mandates are charged at 0.1% to 0.2% p.a. a. priced. In the present case we conservatively calculate 0.1% p.a. a. With GKI, depending on the custodian bank, there are no or only low custody costs of 0.03%. ► Resulting GKI fee savings compared to typical asset managers p. a.: 59,600 EUR = 4,000,000 EUR x (2.50% – 1.01%).

The overall ongoing costs of asset management by us are typically around half of the costs of banks and “independent” asset managers.

With a portfolio volume of 4 million euros, our clients save around 59,600 euros annually compared to investors in conventional asset management. Assuming the same pre-cost return and tax burden, the cost advantage of our approach leads to a final asset advantage of around 33% after 20 years and around 53% after 30 years.

Our asset management also includes comprehensive financial advice, both initially and on an ongoing basis. This financial advice is not billed separately.

Our compensation structure in detail

The following is a non-binding fee indication. The percentage fees in the table below refer to the assets we manage. They are expressed as an annual fee (per annum). A quarter of this percentage fee will be billed at the end of each calendar quarter.

The values ​​in the columns “AUM fee p.a. cumulative (incl. VAT)” and “AUM fee p.a. cumulative (excl. VAT)” are commercially rounded and result from the fee in relation to the individual tranches.

If several members of a family take out a mandate with us, we grant each family member a discount of 10% on the asset management fee calculated in accordance with our discount scale. This results in an additional cost advantage for all family members involved.

Abbreviations: “AUM” = Assets under Management = the assets we manage; Fee = fee

0 to 10 million euros

Assets under management (“AUM”)AUM fee p. a. cumulative (excl. VAT)AUM fee p. a. cumulative (VAT included.)
1.000.000 €0,756%0,900%
1.500.000 €0,742%0,883%
2.000.000 €0,725%0,863%
2.500.000 €0,706%0,840%
3.000.000 €0,686%0,817%
3.500.000 €0,666%0,793%
4.000.000 €0,646%0,769%
4.500.000 €0,626%0,744%
5.000.000 €0,605%0,720%
5.500.000 €0,584%0,695%
6.000.000 €0,564%0,671%
6.500.000 €0,543%0,646%
7.000.000 €0,522%0,621%
7.500.000 €0,504%0,600%
8.000.000 €0,488%0,581%
8.500.000 €0,475%0,565%
9.000.000 €0,462%0,550%
9.500.000 €0,451%0,537%
10.000.000 €0,441%0,525%

10 to 20 million euros

Assets under management (“AUM”)AUM fee p. a. cumulative (excl. VAT)AUM fee p. a. cumulative (VAT included.)
10.500.000 €0,432%0,514%
11.000.000 €0,424%0,505%
11.500.000 €0,417%0,496%
12.000.000 €0,410%0,488%
12.500.000 €0,403%0,480%
13.000.000 €0,398%0,473%
13.500.000 €0,392%0,467%
14.000.000 €0,387%0,461%
14.500.000 €0,382%0,455%
15.000.000 €0,378%0,450%
15.500.000 €0,374%0,445%
16.000.000 €0,370%0,441%
16.500.000 €0,367%0,436%
17.000.000 €0,363%0,432%
17.500.000 €0,360%0,429%
18.000.000 €0,357%0,425%
18.500.000 €0,354%0,422%
19.000.000 €0,352%0,418%
19.500.000 €0,349%0,415%
20.000.000 €0,347%0,413%

20 to 30 million euros

Assets under management (“AUM”)AUM fee p. a. cumulative (excl. VAT)AUM fee p. a. cumulative (VAT included.)
20.500.000 €0,344%0,410%
21.000.000 €0,342%0,407%
21.500.000 €0,340%0,405%
22.000.000 €0,338%0,402%
22.500.000 €0,336%0,400%
23.000.000 €0,334%0,398%
23.500.000 €0,333%0,396%
24.000.000 €0,331%0,394%
24.500.000 €0,329%0,392%
25.000.000 €0,328%0,390%
25.500.000 €0,326%0,388%
26.000.000 €0,325%0,387%
26.500.000 €0,323%0,385%
27.000.000 €0,322%0,383%
27.500.000 €0,321%0,382%
28.000.000 €0,320%0,380%
28.500.000 €0,318%0,379%
29.000.000 €0,317%0,378%
29.500.000 €0,316%0,376%
30.000.000 €0,315%0,375%

30 to 40 million euros

Assets under management (“AUM”)AUM fee p. a. cumulative (excl. VAT)AUM fee p. a. cumulative (VAT included.)
30.500.000 €0,314%0,374%
31.000.000 €0,313%0,373%
31.500.000 €0,312%0,371%
32.000.000 €0,311%0,370%
32.500.000 €0,310%0,369%
33.000.000 €0,309%0,368%
33.500.000 €0,309%0,367%
34.000.000 €0,308%0,366%
34.500.000 €0,307%0,365%
35.000.000 €0,306%0,364%
35.500.000 €0,305%0,363%
36.000.000 €0,305%0,363%
36.500.000 €0,304%0,362%
37.000.000 €0,303%0,361%
37.500.000 €0,303%0,360%
38.000.000 €0,302%0,359%
38.500.000 €0,301%0,358%
39.000.000 €0,301%0,358%
39.500.000 €0,300%0,357%
40.000.000 €0,299%0,356%

40 to 50 million euros

Assets under management (“AUM”)AUM fee p. a. cumulative (excl. VAT)AUM fee p. a. cumulative (VAT included.)
40.500.000 €0,299%0,356%
41.000.000 €0,298%0,355%
41.500.000 €0,298%0,354%
42.000.000 €0,297%0,354%
42.500.000 €0,297%0,353%
43.000.000 €0,296%0,352%
43.500.000 €0,296%0,352%
44.000.000 €0,295%0,351%
44.500.000 €0,295%0,351%
45.000.000 €0,294%0,350%
45.500.000 €0,294%0,349%
46.000.000 €0,293%0,349%
46.500.000 €0,293%0,348%
47.000.000 €0,292%0,348%
47.500.000 €0,292%0,347%
48.000.000 €0,291%0,347%
48.500.000 €0,291%0,346%
49.000.000 €0,291%0,346%
49.500.000 €0,290%0,345%
50.000.000 €0,290%0,345%

50 to 75 million euros

Assets under management (“AUM”)AUM fee p. a. cumulative (excl. VAT)AUM fee p. a. cumulative (VAT included.)
50.500.000 €0,290%0,345%
51.000.000 €0,289%0,344%
51.500.000 €0,289%0,344%
52.000.000 €0,288%0,343%
52.500.000 €0,288%0,343%
53.000.000 €0,288%0,342%
53.500.000 €0,287%0,342%
54.000.000 €0,287%0,342%
54.500.000 €0,287%0,341%
55.000.000 €0,286%0,341%
55.500.000 €0,286%0,341%
56.000.000 €0,286%0,340%
56.500.000 €0,286%0,340%
57.000.000 €0,285%0,339%
57.500.000 €0,285%0,339%
58.000.000 €0,285%0,339%
58.500.000 €0,284%0,338%
59.000.000 €0,284%0,338%
59.500.000 €0,284%0,338%
60.000.000 €0,284%0,338%
60.500.000 €0,283%0,337%
61.000.000 €0,283%0,337%
61.500.000 €0,283%0,337%
62.000.000 €0,283%0,336%
62.500.000 €0,282%0,336%
63.000.000 €0,282%0,336%
63.500.000 €0,282%0,335%
64.000.000 €0,282%0,335%
64.500.000 €0,281%0,335%
65.000.000 €0,281%0,335%
65.500.000 €0,281%0,334%
66.000.000 €0,281%0,334%
66.500.000 €0,281%0,334%
67.000.000 €0,280%0,334%
67.500.000 €0,280%0,333%
68.000.000 €0,280%0,333%
68.500.000 €0,280%0,333%
69.000.000 €0,280%0,333%
69.500.000 €0,279%0,332%
70.000.000 €0,279%0,332%
70.500.000 €0,279%0,332%
71.000.000 €0,279%0,332%
71.500.000 €0,279%0,331%
72.000.000 €0,278%0,331%
72.500.000 €0,278%0,331%
73.000.000 €0,278%0,331%
73.500.000 €0,278%0,331%
74.000.000 €0,278%0,330%
74.500.000 €0,277%0,330%
75.000.000 €0,277%0,330%

75 to 100 million euros

Assets under management (“AUM”)AUM fee p. a. cumulative (excl. VAT)AUM fee p. a. cumulative (VAT included.)
75.500.000 €0,277%0,330%
76.000.000 €0,277%0,330%
76.500.000 €0,277%0,329%
77.000.000 €0,277%0,329%
77.500.000 €0,276%0,329%
78.000.000 €0,276%0,329%
78.500.000 €0,276%0,329%
79.000.000 €0,276%0,328%
79.500.000 €0,276%0,328%
80.000.000 €0,276%0,328%
80.500.000 €0,276%0,328%
81.000.000 €0,275%0,328%
81.500.000 €0,275%0,328%
82.000.000 €0,275%0,327%
82.500.000 €0,275%0,327%
83.000.000 €0,275%0,327%
83.500.000 €0,275%0,327%
84.000.000 €0,275%0,327%
84.500.000 €0,274%0,327%
85.000.000 €0,274%0,326%
85.500.000 €0,274%0,326%
86.000.000 €0,274%0,326%
86.500.000 €0,274%0,326%
87.000.000 €0,274%0,326%
87.500.000 €0,274%0,326%
88.000.000 €0,274%0,326%
88.500.000 €0,273%0,325%
89.000.000 €0,273%0,325%
89.500.000 €0,273%0,325%
90.000.000 €0,273%0,325%
90.500.000 €0,273%0,325%
91.000.000 €0,273%0,325%
91.500.000 €0,273%0,325%
92.000.000 €0,273%0,324%
92.500.000 €0,273%0,324%
93.000.000 €0,272%0,324%
93.500.000 €0,272%0,324%
94.000.000 €0,272%0,324%
94.500.000 €0,272%0,324%
95.000.000 €0,272%0,324%
95.500.000 €0,272%0,324%
96.000.000 €0,272%0,323%
96.500.000 €0,272%0,323%
97.000.000 €0,272%0,323%
97.500.000 €0,271%0,323%
98.000.000 €0,271%0,323%
98.500.000 €0,271%0,323%
99.000.000 €0,271%0,323%
99.500.000 €0,271%0,323%
100.000.000 €0,271%0,323%

For reasons of presentation, the remuneration structure on mobile devices is only broken down up to 10 million euros. For higher portfolio volumes, please visit our website on a desktop device or contact us.

The minimum investment amount is currently one million euros.

When comparing the remuneration of banks and independent asset managers, please note that almost all of them quote exclusive of VAT in order to appear cheaper than they actually are. Furthermore, these service providers often incur additional fee components that are often difficult to recognize for customers, so that the actual total costs (all-in costs) are higher than the costs recognized by the investor. Examples of other asset management costs include: Performance fees, higher ongoing product costs (some with refunds), higher transaction costs or custody fees. A cost burden that is particularly difficult to recognize from the outside results from the so-called bid-ask spreads, which, when calculated in euros, are high when there is a lot of back and forth trading. This does not happen with our asset management because our investment decisions are based on a long-term investment strategy.

Ultimately, taxes are also costs. We reduce the effective tax burden in our client portfolios through a systematic buy-and-hold approach (see explanation here) and, especially in the equities sector, by focusing on investment funds (ETFs) with legal domicile in Ireland, which can reduce the withholding tax burden on dividends.

How to reach us

If you want asset management and financial advice with a personal contact from an investment amount of 1 million euros If you are interested, we will be happy to assist you Free and non-binding initial consultation available.

We will answer all your questions in a personal conversation and help you find out whether we are a good fit for each other.

Monday to Friday from 9:00 a.m. to 5:00 p.m

Frequently asked questions

Does GKI receive commissions, kickbacks or kickbacks from third parties?

No. Gerd Kommer Invest does not accept any commissions, commissions or refunds from product providers.

We do not use any in-house products and are exclusively supplied via one Assets under management fee (AuM fee) paid directly by our clients. This compensation model avoids conflicts of interest and ensures that investment decisions are made exclusively in the interests of the clients.

Will asset management costs go down if I invest larger amounts or pool family assets?

Yes. The administration fee follows one degressive discount scale.

It starts at 0.900% p.a. (including VAT) for an investment volume of 1 million euros and decreases as assets increase - down to around 0.323% for very large volumes. Family members can pool their portfolios to calculate fees. Thanks to this bundled volume, everyone involved benefits more quickly from lower fee rates.

Why does Gerd Kommer Invest waive performance fees in asset management?

Gerd Kommer Invest We deliberately avoid performance-related remuneration, as performance fees often lead to higher overall costs in the long term and can create problematic incentives. Such fees sometimes motivate asset managers to take unnecessary risks in order to achieve short-term success.

Instead, clients only pay us transparently Assets under management fee (AuM fee) away 0.3% p.a. a. This means that costs remain predictable, understandable and fair.