
From Gerd Kommer and Daniel Chancellor
The investor community's never-ending search for exploitable regularities and patterns in the stock market has recently brought to light a new supposed basic pattern: the thesis that the US stock market structurally or systematically generates higher returns than the "world without the USA" stock market region. One could easily describe this “theory” with the term “US exceptionalism” borrowed from historical science. [1] title.
In this blog post, we will use empirical, theoretical and factual arguments to show that the US exceptionalism thesis applied to the US stock market is probably wrong and that private investors who base their investment strategy too closely on it could experience disappointment in the next few years.
First of all, the question of where the stock market US exceptionalism thesis comes from.
At some point in the last few years, a sufficiently large number of business journalists, finfluencers and investors noticed that the US stock market has been falling since around April 2008 [2] to date has delivered a noticeably higher return than the aggregate return of the other almost 50 countries with relevant stock markets – the “World without USA”/“World ex USA” region. Logically, the US market return was also higher than that of the global stock market during this period.
This finding was then combined with a second one: In the historical capital market database of the three British finance professors Dimson, Marsh and Staunton, which is now quite well known among advanced stock market experts and goes back to 1900, the US stock market also shows a higher return than the region over the entire period of 124 years (beginning of 1900 to the end of 2023). World ex USA in the form of the 20 other Western countries for which the available data goes back as far. [3] Table 1 illustrates the situation.
Table 1: Comparison of inflation-adjusted stock market returns in three regions: US, World ex US and World – real returns in USD
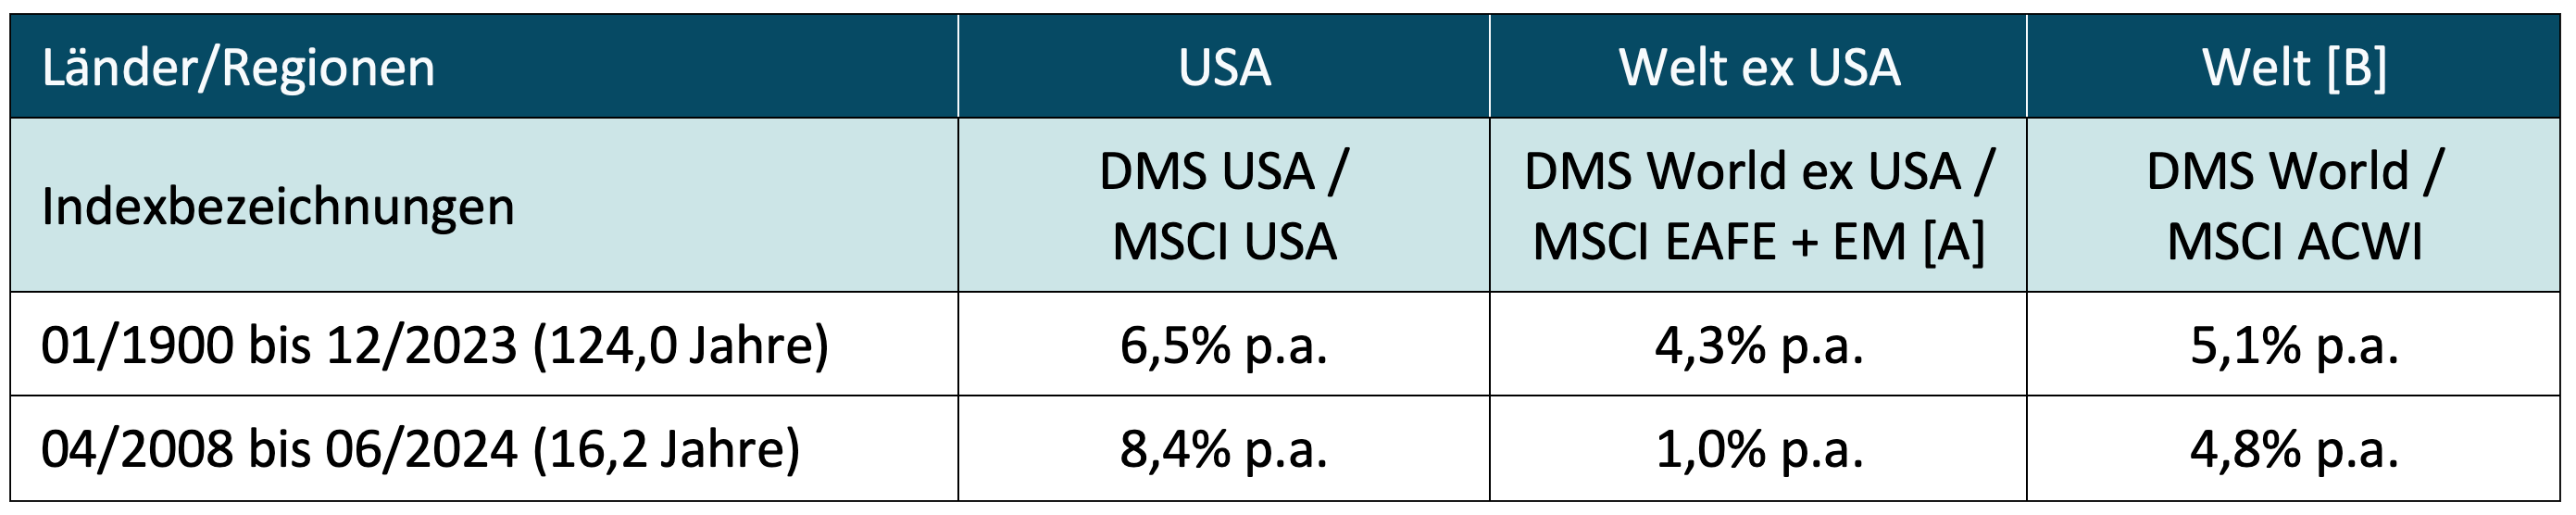
► Without costs and taxes. ► [A] “MSCI EAFE + EM” is the MSCI index that includes all developed countries excluding the USA and Canada and all emerging markets. EAFE stands for “Europe, Asia, Far East”, EM stands for “Emerging Markets” (each according to MSCI definition). ACWI stands for All Country World Index (developed and emerging markets). ► Original underlying data: Dimson/Marsh/Staunton (DMS) for the 124-year period, MSCI and Dimensional Fund Advisors for the shorter period.
For the shorter period in the bottom row in Table 1, with more or less equal relative return differences between the three regions, one could alternatively use the last five or the last ten years, but not - and this is important - periods that go back significantly further than 16 years. More on that below.
Standard explanations for the supposed USA yield advantage
The following three reasons are usually given to explain the return differences in Table 1 between the US and World ex US regions:
(a) The United States is a more “dynamic” economy than the rest of the world.
(b) The tech sector (high-tech sector) has a higher weight in the US stock market than in the rest of the world. Tech stocks are simply more profitable than the other sectors/industries.
(c) Since the US stock market has produced higher returns than the rest of the world over the last decade and a half, as well as over the very long term, this is a structural factor that is likely to continue into the long term future.
Let's start with reason (a), the supposedly particularly "dynamic" US economy. Presumably, dynamic here means “faster growing” or “more innovative”. We address both meanings below.
The data in Table 2 show that over the past 20 years, economic growth in the United States has been no higher than the aggregate growth of all the remaining approximately 195 countries in the world. [4] The Europe region, often referred to as “sclerotic,” beat the United States in economic growth over the past two decades. [5] Over the last 50 years, the United States has had only a small, arguably negligible lead over the rest of the world.
The largest single world region shown here, “East Asia & Pacific” (which includes, for example, China, India, Indonesia, Vietnam, Japan and Australia, Hong Kong, Singapore) has been growing consistently faster than the USA since the 1970s.
Table 2: Comparison of real economic growth for two periods between the USA and various world regions - inflation-adjusted GDP growth per capita (real GDP growth per capita in USD)
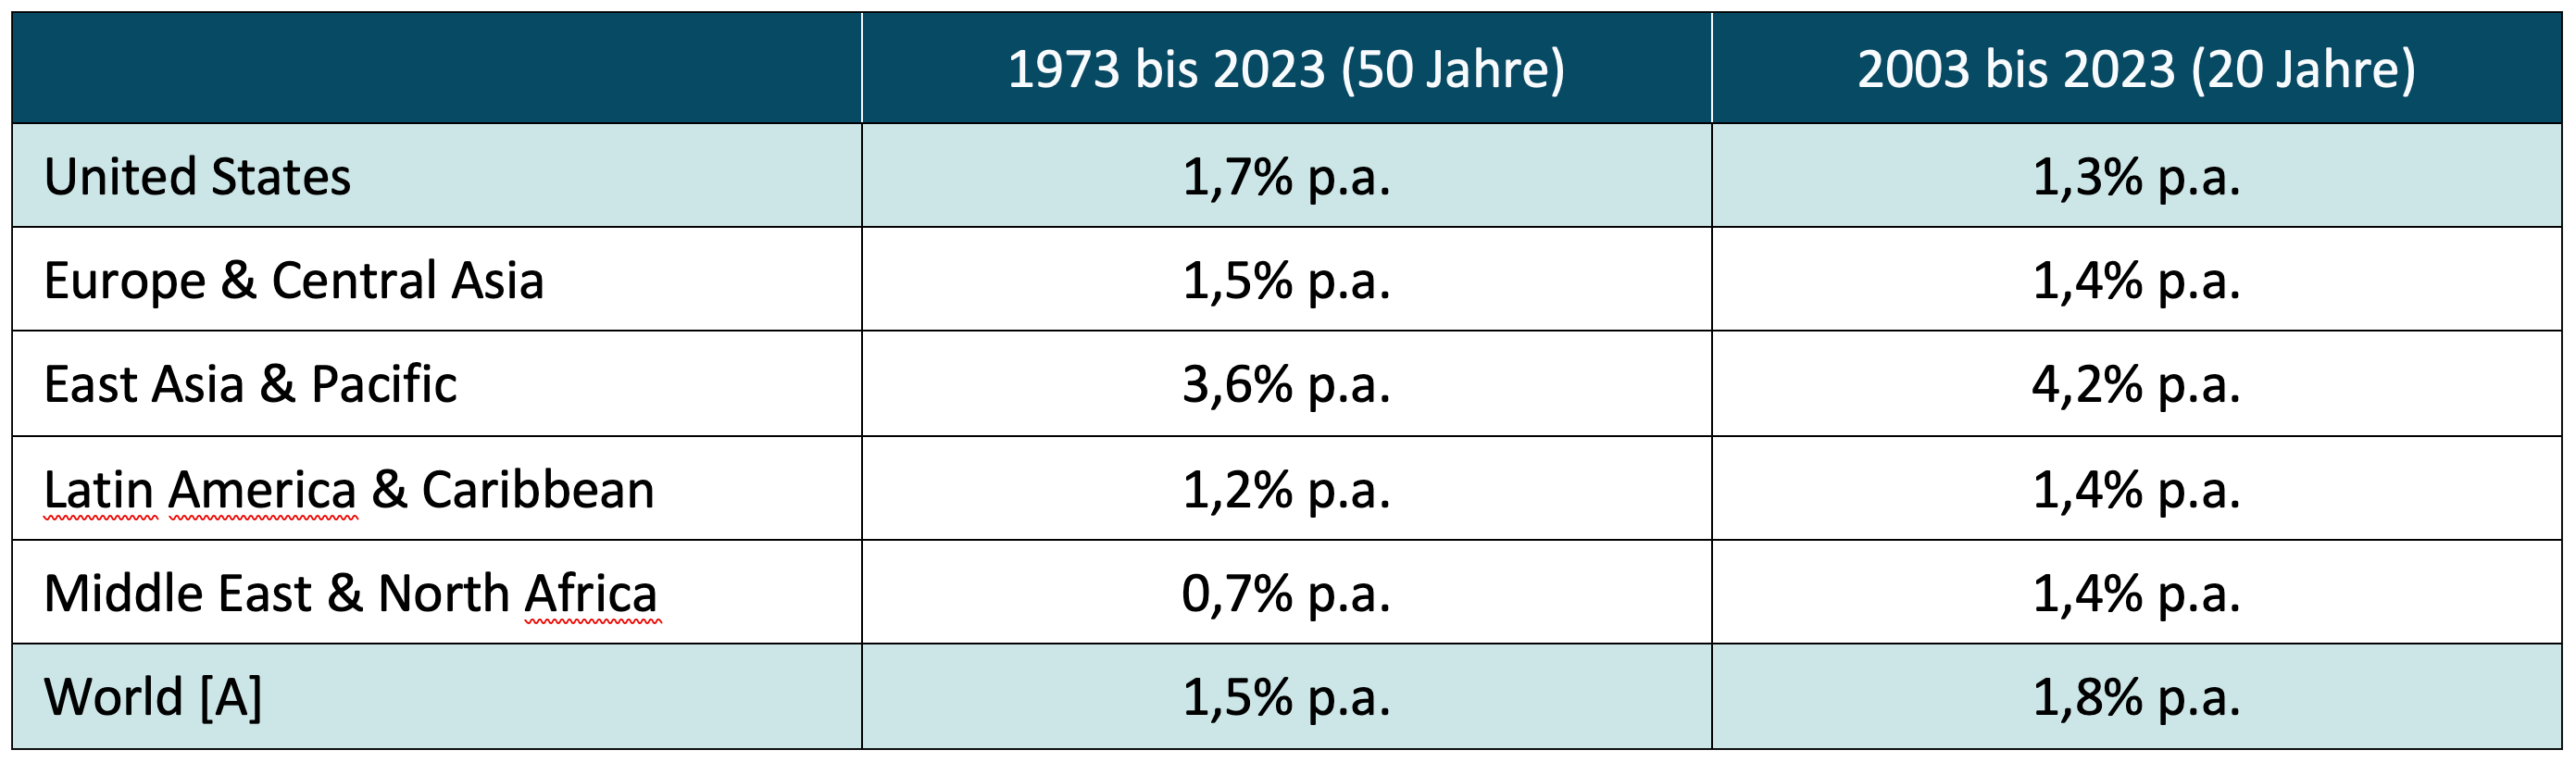
► [A] All countries in the world (Developed Countries). ► GDP = Gross Domestic Product, GDP = Gross Domestic Product. ► Underlying original data: World Bank (World Bank). ► If the growth in absolute GDP had not been used for this evaluation, the result would have been only slightly different. In principle, we consider per capita growth to be more meaningful in this context.
But the numbers in Table 2 are not the only argument that calls into question the thesis of the “dynamic” US economy as the main reason for the supposedly particularly high US stock market returns. Another equally important argument is of a fundamental nature.
No connection between economic growth and stock market returns
There is no statistical relationship between national economic growth and national stock market returns for periods ranging from one year to probably 30 years, much less one that investors can exploit forward to their benefit. [6] This fact has been proven several times and probably definitively by scientists.
Anyone who appears in public as an “expert” and argues explicitly or implicitly that one should invest more in the stock markets of countries or regions with high economic growth is outing themselves as someone who does not know the scientifically proven facts or who deliberately ignores them for unfair motives (e.g. conflicts of interest). Even more ridiculous is the constant drawing of connections by “experts” between national stock market returns in the short or medium term future and the expected growth rates of Country A versus Country B over the following year or two. [7]
We have documented the lack of connection between economic growth and stock market returns several times, e.g. b. here and here and here and also set out the well-known and very clear reasons for the lack of a connection.
Startups in the “dynamic” US economy
Occasionally, in media articles, the term “dynamic economy” instead of “higher economic growth” also means that the USA has a larger or more innovative startup scene than Europe or other regions of the world, or that there are more IPOs in the USA than in Europe. This should contribute to the good returns on the US stock market. This logic isn't far off either.
Startups and the venture capital investments that go with them have little or nothing to do with the returns of listed companies. Most startups don't survive their first ten years anyway. Of the minority that survives, the vast majority will not achieve a stock exchange listing due to lack of sufficient growth or other reasons. The tiny fraction of startups that eventually go public typically do so a decade or more after the company was founded. You can no longer speak of a “startup” when you go public. And last but not least: “IPO stocks” (stocks that had their initial public offering in the last 24 months) produce statistically below-average returns during this period. They drag the overall stock market down rather than up (see here).
In terms of the first interim conclusion, the situation can be summarized as follows: (a) The US economy is not growing systematically faster than the economies of other large regions or countries. (b) There is no connection between national economic growth and national stock market returns that can be exploited with sufficient reliability for investors. (c) The large startup and venture capital market in the USA does not have any significant influence on the returns of the US stock market.
Are tech stocks pushing the US stock market?
Now to reason (b) for the (supposedly) higher returns of the US stock market: The higher share of the tech sector in the US stock market.
In fact, the US stock market has a larger tech share. This is confirmed in Table 3. (The respective stock market is broken down into twelve “sectors” by MSCI and other data providers. These sectors could be referred to as “major industries” (other data providers sometimes only have eleven or ten sectors).
Table 3: Share of the tech sector (information technology) in the US stock market and in the stock markets of two other world regions (as of June 30, 2024)
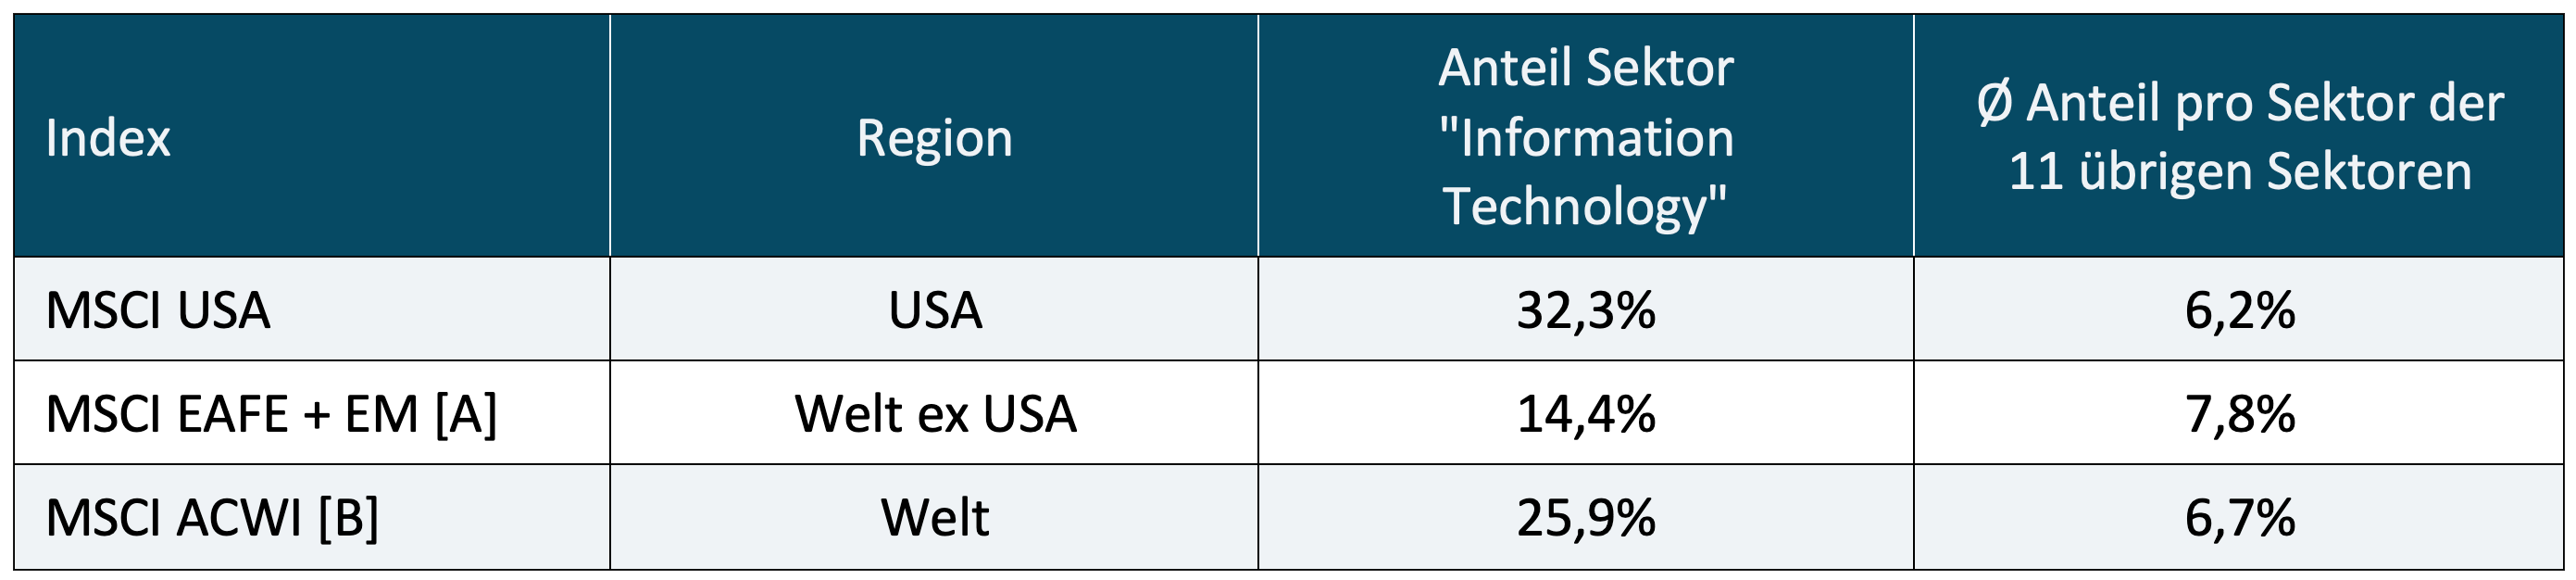
► [A] “MSCI EAFE + EM” is the MSCI index that includes all developed countries excluding the USA and Canada and all emerging markets. EAFE stands for “Europe, Asia, Far East”, EM stands for “Emerging Markets” (each according to MSCI definition). [B] ACWI stands for All Country World Index, an MSCI index that reflects all 23 developed markets and all 26 emerging markets (each according to MSCI definition). ► Source: Fact sheets of the respective MSCI indices as of June 30, 2024.
Although the tech sector actually makes up a significantly larger share of US stock markets than any of the other sectors, as shown in Table 3, this does not prove that the US stock market is or should be systematically more profitable than the rest of the world in the long term and systematically. It doesn't because there is no reliable evidence that tech stocks à la longue produce a more attractive absolute return or risk-weighted return (Sharpe Ratio) than the overall market or the best other sector in a given long time frame. This is shown in Table 4.
Table 4: Return and risk of two sectors and the entire US stock market - in USD, nominal from 1983 to 2023 (41 years)

► Without costs and taxes. ► The overall market is divided into ten sectors in the underlying database. MSCI's different sector definition with twelve sectors would not lead to a significant difference. ► Volatility: annualized volatility of the standard deviation of monthly returns. ► Risk-weighted return: Simplified Sharpe ratio defined here as: Arithmetic Ø of monthly returns ÷ standard deviation of monthly returns. ► Underlying original data: Ken French Data Library.
Did the Internet cause a structural break in the data?
For the calculations in Table 4, we chose 1983 as the starting point because it is given as the birth year of the Internet. Some “tech experts” believe that the emergence of the Internet has caused an economic “structural break” in the distribution of sector returns in the stock market. Both could be a mistake, but for reasons of space we will not go into this further. Nevertheless, we use January 1983 as the starting point to counter this argument. If we had gone back even further in our calculations (e.g. to 1970 or 1960), the picture shown in Table 4 would become more solid: in the long term, the return of the tech sector is close to that of the market as a whole - with higher volatility at the same time. This results in a poor risk-weighted return for the tech sector, at least when viewed in isolation.
Some believe that artificial intelligence (AI) will give the tech sector a previously unavailable “return booster” in the future. We explained in our recent blog post that and why such an idea is unrealistic (see here).
The high tech returns over the last 15 years or so have resulted in a current very high valuation for the tech sector. At the end of June 2024, the P/E ratio was [8] the MSCI World Information Technology Index 41. A normal, “fair” P/E ratio should be between 16 and 18. By contrast, the corresponding P/E ratio for the broader MSCI World overall market index was a “less alarming” 22.
The high tech valuation is due to the fact that the prices of tech stocks have risen far more in recent years than the previous profits of tech companies. The prevailing wisdom in academic stock market research is that returns of asset classes over extended periods of time are a function of their valuation levels at the beginning of the period. That doesn't bode well for the tech sector.
If you want to get a quick overview of what science says about the supposedly structurally higher long-term returns of tech stocks, we recommend the essay by Bessembinder (2020 - here). Bessembinder sees no evidence of systematic outperformance of tech stocks.
Our second interim conclusion is therefore: (1) Yes, US tech stocks have delivered much higher returns than those of other sectors over the last 15 years or so, but if you go further back in time, tech returns are approaching those of the market as a whole. The most long-term profitable sector since 1970 (the earliest possible point from which data is available for all ten or twelve sectors [9]) is not tech, but health care. (2) The tech sector has repeatedly underperformed the overall market over periods of ten years or more - like all other sectors. Beginning in the early 2000s, there was a period of over ten years in which the tech sector delivered disastrous returns (Table 4). Additionally, the tech sector is particularly volatile. His temporarily high returns are therefore not a free lunch. (3) Academic research has, among other things, provided no evidence of structurally higher tech returns. (4) The high returns in the recent past have led to high valuations and could therefore lead to below-average tech returns in the future - just as they did from the end of 1999.
Have US stock returns historically been significantly higher than those of other countries?
Finally, we want to ask and answer a very fundamental, “heretical” question. Is it even true that US stock returns have been higher than the rest of the world over the very long term? The prevailing wisdom and the data in Table 1 seem to suggest so. From our point of view, doubts should also be raised here. Table 5 suggests why we see it this way.
Table 5: Comparison of inflation-adjusted (real) stock market returns for the US and the World ex US region from 1900 to 2023 - returns in USD

► Without costs and taxes. ► [A] These are the countries Australia and New Zealand - two states that, geographically, were “far away” from the First and Second World Wars (see argument in the ongoing text). ► [B] These are the countries Japan, Germany, Netherlands, Sweden, Denmark and Ireland. ► Underlying original data: Dimson/Marsh/Staunton.
Table 5 shows that most of the U.S. return advantage over the entire 124-year period occurred in the first 50 years, the period in which two world wars greatly devastated the labor pool, infrastructure, capital markets, and monetary systems of Europe and Japan, [10] while the USA was little affected economically and in terms of capital markets by the two world wars or possibly benefited from them - relatively or even absolutely.
In other words: Over four fifths of the outperformance of the US market over the entire period of 124 years occurred in the first 50 years in a historically unique period, less than a fifth of the outperformance in the 74 years, which are probably more representative of the future, without “one-sided” world war effects to the disadvantage of Europe and Japan and to the advantage of the USA. We consider it an unconvincing assumption that one or two world wars will happen again in the next 20 or 50 years, which will only have an impact on non-US economies/capital markets and in favor of the US.
Anyone who follows our way of thinking should only take into account the period from around 1950 when calculating the historical outperformance of the US stock market, because the period before that presumably has no significance for the future in the sense relevant here. If you do that, the historical US yield advantage shrinks by over 80%.
Incidentally, from 1950 to the present, the United States was only the seventh most profitable stock market among 21 countries (see explanations below Table 5). From this perspective, it is US outperformance versus the region World ex USA to a certain extent an artificial data artifact that results from the splitting of the world stock market into just two large regions that has been common for several years, but is by no means free of question marks or even a given.
If you now consider that at the end of these 124 years (December 2023) and today (as of June 30, 2024), the US stock market had a valuation in terms of the P/E ratio that was around 70% higher than the World region ex USA, [11] then, in our opinion, it becomes clear that the thesis of structurally higher returns on the US stock market is on shaky ground.
If our analysis and interpretation of long-term historical data is not convincing, we invite you to make the small effort to search for publications by university researchers that support the thesis of structurally higher US stock market returns, the US exceptionalism thesis with respect to stocks. We were unable to find such an essay. Two essays, the we found are van Binsbergen et al. (2023 – here) and Anarkulova et al. (2024 – here), which tend to reject the US exceptionalism thesis.
Conclusion
In this blog post we presented numbers and arguments that, in our opinion, prove that the US stock market has, over several years (like any national stock market), but not systematically is more profitable than other relevant stock markets. The fact that so many market participants currently believe in the US exceptionalism thesis has to do with a series of errors, mistakes and myths that are constantly being spread by the media, the financial industry, advice book authors and finfluencers because this benefits them directly or indirectly. In summary these are the following:
- The common human error in thinking Recency Bias, [12] i.e. our tendency to view the recent past (a small sample of data) as particularly representative of the future, even if this is not justified for technical reasons in the case in question.
- The erroneous belief that the American economy has grown faster in recent decades and will therefore continue to grow faster than those of other countries or regions. In this context, the further false conclusion that the level of national economic growth has an influence on the respective national stock market also plays a role.
- The mistake of concluding that the large and dynamic startup market in the USA contributes to high returns on the US stock exchanges.
- The mistaken belief that the tech sector, which has a greater weight in the US stock market than elsewhere, produces more attractive long-term returns than the overall market or any other sector. Since the invention of the Internet around 40 years ago, health has been the most profitable of ten sectors in the US, not tech.
- Not knowing that over four-fifths of the U.S. stock market's outperformance over the last 124 years (the maximum period for which data is available) was concentrated in the first 50 years of the 20th century and is believed to be strongly related to the specific and unique historical events of World War I and World War II.
Overall, the thesis of US stock exceptionalism is the result of a selective, truncated and often simply incorrect evaluation and interpretation of data or other economic facts.
Private investors who base their forward investment strategy heavily on the expectation of structurally higher US stock market returns in the future could be in for an unpleasant surprise due to the comparatively high valuations of US stocks and US tech stocks in the next few years. It should be borne in mind that in many investors' stock portfolios, US stocks make up two-thirds or more. We consider this to be too high a weighting for the reasons set out here.
Endnotes
[1] “Exception” or “singularity” of the USA.
[2] April 2008 was mathematically in the first third of the stock market crash of the Great Financial Crisis, which from a macroeconomic perspective lasted from the beginning of 2008 to the end of 2011.
[3] The annual update of the Dimson-Marsh-Staunton data is also known as the “UBS Global Investment Returns Yearbook” (until recently the “Credit Suisse Global Investment Returns Yearbook”).
[4] Incidentally, the USA's national debt is much higher relative to the average of the other 195 countries. At around 125%, the “national debt to GDP” ratio for the USA is now so high that the scope for further increases appears to have been exhausted.
[5] In addition to all of Europe, the “Europe & Central Asia” region also includes Turkey, Russia and several former Soviet republics. However, due to their small economies, the latter are not significant here.
[6] The existing data series are too short to be able to statistically verify a corresponding statement for longer periods of time, i.e. around 30 years.
[7] A more recent example of such articles is Christiane von Hardenberg: "The MSCI World is too American-heavy? That's a good thing!", FAZ-Online, June 25, 2024.
[8] P/E ratio = price-earnings ratio (a valuation ratio).
[9] Depending on the database used, there are 10 or 12 sectors.
[10] In the case of Japan, this only applies to World War II.
[11] Measured against the P/E ratios of the MSCI USA Index and the MSCI EAFE+EM Index. Measured by the alternative valuation metric price-to-book ratio, the higher valuation of the USA is even more extreme.
[12] “Recency” = recentness, “bias” = bias, distortion, tendency.
literature
Anarkulova, Aizhan et al. (2024): “Long Horizon Losses in Stocks, Bonds, and Bills”; January 11, 2024; Internet reference: SSRN – here
Bessembinder, Hendrik (2020): “Extreme Stock Market Performers, Part II: Do Technology Stocks Dominate?” July 2020; Internet reference: SSRN – here
Kommer, Gerd/Schweizer, Jonas (2023): “Does economic knowledge help when investing?”; blog post; March 3, 2023; Internet reference: here
van Binsbergen, Jules et al. (2023): “Is The United States A Lucky Survivor: A Hierarchical Bayesian Approach”; October 9, 2023; Internet reference: SSRN – here