
From Gerd Kommer and Felix Großmann
This post was updated in April 2025.
A particularly heavy monsoon of bad news is currently raining down on us as citizens and private investors in the media: record inflation, explosion in prices for electricity and gas, possible freezing at home in the coming winter, risk of recession, rise in interest rates, “hardly any home purchases can be financed anymore”, Putin, a crazy dictator who has started a dangerous war in Eastern Europe and more general political frustration than ever.
The year 2022 has not gone well on the stock market either. A few days ago on September 30, 2022, the MSCI World Index was down 14% in euros and down 25.5% in US dollars compared to its last high on January 4, 2022.
It's no surprise then that fears of a severe stock market crash are resurfacing in the public discussion. And whenever that is the case, we inevitably come across a reference somewhere to the “crash of the century” in the Great Depression 95 years ago. The stock market began to collapse in September 1929, heralding the real economic “Great Depression” of 1929 to 1933 - the worst economic crisis in the USA in the last 120 years and - for the USA - perhaps even longer. From 1929 to 1933, US economic output per capita shrank by 31%, adjusted for inflation.
In France, gross domestic product per capita fell by 30% by 1933, in Germany by 21% and in Great Britain by 9%. In the Western countries for which economic growth data is available, the economic downturn was overall less severe than in the USA and the recovery from 1933 was faster and more sustained.
According to the dominant opinion among university economists, the cause of the significantly deeper and longer economic crisis in the USA relative to other countries lay in the economic policy mistakes of the Roosevelt administration at the time. [1] From 1933 to about 1941, President Franklin Roosevelt practiced an overall chaotic stop-and-go monetary policy, had a harmful tendency toward socialist central planning measures with government price fixing, and unsettled the economy with arbitrary pogroms against some large corporations and their boards of directors that did not suit Roosevelt. In general, his economic policies were too erratic and interventionist. Even the famous “economist of the century” John Maynard Keynes, who was very interventionist in his turn, accused Roosevelt of making fatal mistakes.
In order to adequately understand the extent of the global recession at that time, one must remember that in most countries at that time none of the social security systems that are now taken for granted in the West, such as social assistance, unemployment insurance, statutory health insurance or pension insurance, existed. [2] Furthermore, at the beginning of the crisis, the level of prosperity (and thus the wealth reserves of private households) in Western countries was only about a quarter or a fifth of its current level.
The accompanying stock crash at the time is also considered by the investor community to be the worst of all stock market crashes since the beginning of the 20th century. Since then, with every new potential or actual stock crisis, this horror crash has been mentioned with the implication: “This is how bad it can get in the worst case scenario.”
According to the prevailing opinion that has been spread in advice books, in the traditional financial media, by finfluencers and even in school textbooks for years, “this bad” means: 89% collapse (maximum drawdown / MDD) and an agonizing 25 years until full recovery in November 1954.
Many readers of this blog will have heard or read these numbers somewhere. At the end of our article we give examples of seven sources that report this data. Hundreds more could quickly be found via Google. They are also found in almost every school textbook on the history of the 20th century.
It's just unfortunate that the epidemically widespread combination of numbers "89% slump" and "25 years until complete recovery" is wrong. The facts are less spectacular and far less dramatic.
These facts are: “Only” 79% slump” and only “seven years to full recovery”. But even these values, upon closer inspection, still give an overly negative picture of the stock market crisis at the time.
But how does the false information come about?
The “standard numbers” for the 1929 crash in the US stock market, 89% drop and 25 years to pre-crash levels, are only correct if you make four mistakes at once:
(1) By using a stock price index exclusive Dividends are based on a total return index including dividends instead of the correct one and an index that is too narrow and not representative of the overall market (the Dow Jones Industrial Average).
(2) By misleadingly calculating nominal rather than real returns.
(3) By ignoring the fact that the global stock market performed better than the US stock market during the period in question and that the US market is not representative of the world stock market anyway.
(4) By ignoring the fact that the maximum drawdown of the global stock market and the US stock market during the Great Depression phase was significantly less deep in a European currency than in USD.
Let's get to the four mistakes behind the weird myth of the crash of the century.
Mistake 1 – Using a pure price index
The Dow Jones stock index (full name Dow Jones Industrial Average/DJIA) is a narrow, poorly diversified US stock index that is not really representative of the entire US stock market and, from today's perspective, has an outdated design. It consists of only 30 companies randomly selected by a committee. Among the many design flaws that this quirky but still strangely popular index has, the most important is that it does not include dividends. It is purely a price index, not a total return index or performance index. No one will seriously doubt that omitting dividends when calculating the return of a stock market over a period of more than six months is an error. The error “price index instead of total return index” is doubly serious in the context of our analysis because dividend yields until the 1960s were generally much higher than today, namely an average of 5.4% for the S&P 500 index in the 50 years from 1900 to 1949 compared to only 2.8% in the 50 years since 1970 (note: the total returns from dividends and Price increases tended to be lower in the first half of the 20th century than in the 72 years afterward). From 1929 to 1954 (during the 25-year recovery period in question), the cumulative dividend yield of the S&P 500 index was 142%. This gigantic source of income is simply swept under the carpet by those who equate the Dow Jones Index without dividends between 1929 and 1954 with “the US stock market”. In addition, in the four years from the end of 1929 to the end of 1933, the DJIA (price index) had a return that was six percentage points lower than the price index variant of the broader and therefore more representative S&P Composite Index (the forerunner of today's S&P 500 index).
Mistake 2 – Calculating in nominal rather than real returns
In normal times, nominal returns (returns including inflation) are higher than real, inflation-adjusted returns - a trivial observation. However, during the Great Depression, substantial deflation occurred in the United States. Consumer goods prices fell by around 10% from January 1930 to June 1932 (the time of the maximum drawdown/MDD in the US stock market) and by another 17% in the nine months thereafter, for a total of 27%, before they began to rise again. Because of this deflation, the MDD of the S&P 500 Index in June 1932, calculated based on real numbers, was counterintuitively a full ten percentage points lower (!) than based on nominal data. The real numbers are of course the correct ones. Only they correctly express the real loss in wealth of an investor, the purchasing power effect.
The following graphic illustrates the differences in price trends from 1928 to 1954 (26 years) between the wrong index and the right one: The Dow Jones Index without dividends and nominal versus the S&P 500 Index real (adjusted for inflation) including dividends.
Figure 1: Development of indexed month-end levels of the US stock market from 1928 to 1954 (26 years) - nominal and real returns in US dollars (logarithmic vertical scale)
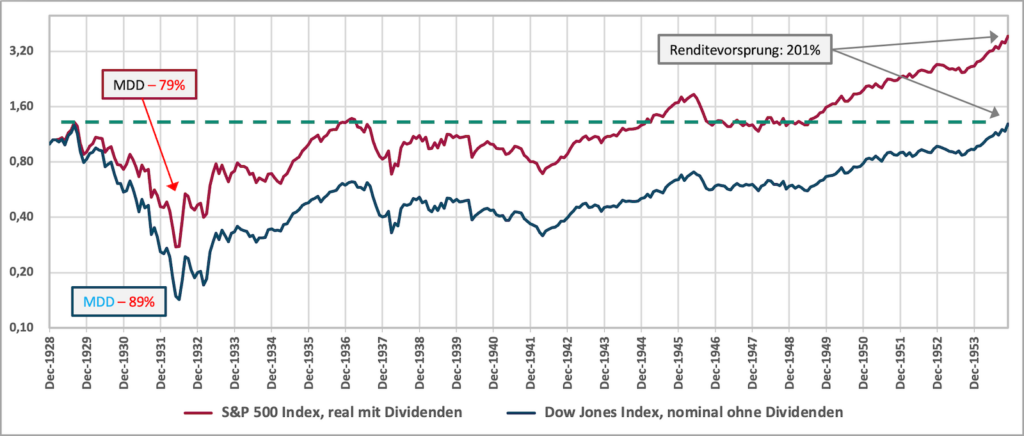
► MDD = Maximum Drawdown = maximum cumulative (book) loss in the observation period. ► Without taxes and costs. ► Data source: Dimensional Fund Advisors, www.macrotrends.net.
In Figure 1 we can see that the correct MDD in the US stock market in June 1932 was only 79% (not 89%) and the pre-crash level was reached in November 1936 (not 1954) and then exceeded for five months (the latter is difficult to see in the graph). A buy-and-hold investor would have fully recouped his losses since the start of the crash in those five months and would have had plenty of time to exit without a loss if he wanted to.
According to the blue Dow Jones curve, the numerical effects of which are still popularized by the majority of “experts” to this day, the final recovery of the US stock market was not complete until November 1954.
The fact that there was a temporary downturn from April 1937 onwards, which was not fully recovered until the beginning of 1945, has nothing to do with the Great Depression, but rather with what, from today's perspective, was a grotesque monetary policy decision made by the US government and the US Central Bank in 1937, namely to raise interest rates in a clearly recognizable economic crisis, which was then followed almost immediately by the start of the Second World War, another separate event. The subsequent downturn must therefore be viewed separately from the Great Depression Crash. But either way, the US stock market finally passed the September 1929 level in February 1945, not in November 1954 as is often claimed.
Incidentally, the downturn in question after 1936 only occurred in the US–stock market, but not in the global stock market, as we will see below.
Mistake 3 – equating the US stock market with the world stock market
When we talk about a “severe stock market crash” these days, we are – of course – referring to that global market, not the stock market of a specific region such as North America or Europe, or of a specific individual country, be it Germany, Great Britain, Japan, Austria or the USA. (The US stock market accounted for around 45% of the world stock market in 1929.) In addition, then as now, every stock investor basically has the opportunity to invest worldwide.
The basic idea that “global is representative” of “the stock market” is correct unless one explicitly speaks of a single national or regional stock market. No sensible observer today would seriously dispute it. Then why don't we apply it to the crash of 1929?
The fact that in relation to the 1929 crash, the financial media to this day focuses almost exclusively on the US stock market rather than on the global market is due to two reasons: (a) Convenience of business journalists and finfluencers: US stock market data for such a distant phase is easier to find on the Internet and in other sources - unlike global stock market data - and is almost always already "prepared nicely and ready for use" on the Internet. This pleases the heart of a journalist or finfluencer who wants as little effort and thought as possible at work. (b) The naive and false idea that the US capital market is somehow fundamentally representative of the global capital market or the capital markets of other countries. This false equation does not apply to the stock market, the bond and interest rate market, or the real estate market. That was the case in 1929 and is the case today.
However, for the world stock market (i.e. the at least 15 largest economies at the time) there are only annual returns for the period before 1970 - no monthly returns, which go back to 1926 for the US stock market. These annual returns in the form of total return returns are also less easy to find online and are not necessarily available for free. This makes the task of “correctly calculating the 1929 stock crash for the global market” a little more difficult, but not impossible.
Based on annual returns for the global stock market, the following situation arises: An everyone At the end of the year from 1929 to 1944, the global stock market index, based on the pre-crash peak at the end of 1928 and calculated in dollars, was equal to or higher than the corresponding US stock index. This is illustrated in Figure 2.
Figure 2: Evolution of indexed year-end levels of the US stock market and the global stock market from 1928 to 1945 (18 years) - real returns in US dollars (logarithmic vertical scale)
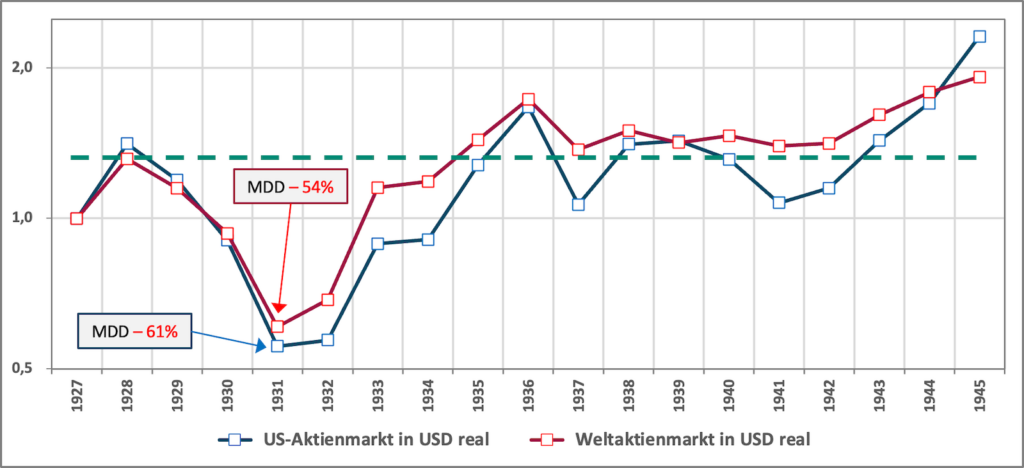
► MDD = Maximum Drawdown = maximum cumulative (book) loss in the observation period. ► Total returns including dividends. ►Without taxes and costs. ► Data: Dimson/Marsh/Staunton – Morningstar.
While the US stock market only reached its pre-crash level at the end of 1928 at the end of 1936 based on annual data, the global stock market did so a year earlier, at the end of 1935. From 1936 onwards, the global market outperformed the US market in terms of returns until 1944.
Interim conclusion: Based on the global stock market, the MDD in 1931/1932 was less deep and the recovery was faster than in the US stock market.
Mistake 4 – Ignoring exchange rate effects
The returns of a single security or an entire market can be calculated in different currencies - a banal statement. Over relatively short periods of time, up to around 15 years, the real and even more so the nominal returns of the same individual stock or stock index in different currencies will often vary greatly.
Instead of always stating stock market returns (those on the US stock market or those on the global stock market) in dollars as a matter of course - and thus misleadingly implying that the dollar is the relevant return calculation currency for investors living outside the USA - one can and should calculate and state the stock return in the currency that is most important for the addressees of the respective publication, namely their home currency, in economist's jargon their "functional currency", i.e. the currency in which they are most likely to use it in the future will spend most of their consumer spending. For investors in German-speaking countries, this currency is clearly not the US dollar.
For the years immediately after 1928, calculating returns in a non-USD currency is a little more difficult than it is today because there was a real “currency chaos” around the world at that time and many currencies from that time no longer exist today, for example the German Reichsmark. We briefly describe this chaos caused by the governments and central banks at the time in our blog post “The Gold Standard: An Engine for Greater Economic Growth?”. For more detail, see the easy-to-read book Lords of Finance: The Bankers Who Broke the World by Ahamed, Liaquat (2009).
Despite the currency chaos at the time, the return on the global stock market can easily be calculated in British pounds as an alternative to the US dollar. In pounds because it was one of the two key global currencies alongside the US dollar until the beginning of the Second World War. At that time, the pound was probably more relevant than the US dollar for German, Austrian and Swiss investors. Figure 3 therefore compares the development of the world stock market from 1928 in British pounds and in USD. The red dollar curve is identical to the red curve in Figure 2.
Figure 3: Development of indexed year-end levels of the global stock market from 1927 to 1945 (18 years) - real returns in US dollars and in GBP (logarithmic vertical scale)
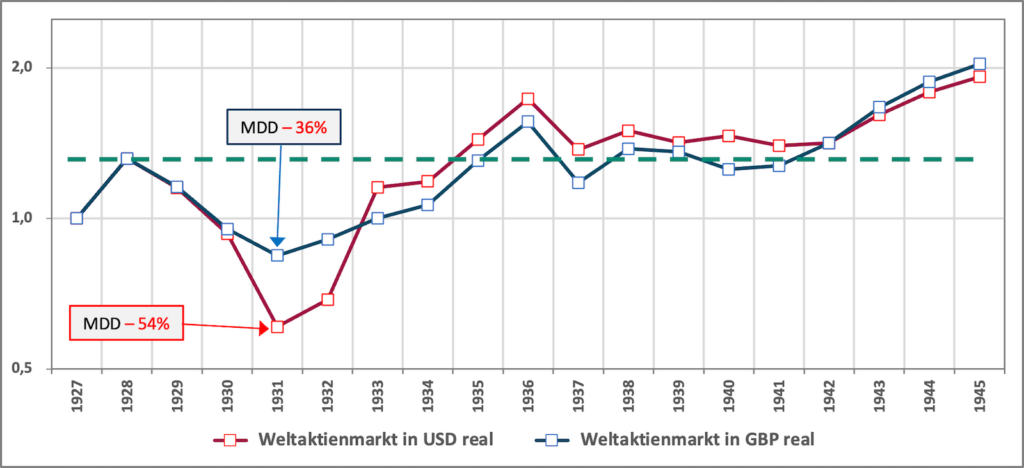
► MDD = Maximum Drawdown = maximum cumulative (book) loss in the observation period. ► Total returns including dividends. ►Without taxes and costs. ► Data: Dimson/Marsh/Staunton – Morningstar.
Figure 3 shows that the return trend of the world stock market (blue curve) calculated in pounds (and therefore probably similar in other European currencies) was drastically better during the Great Depression, especially with regard to the MDD than in USD, namely only minus 36% in GBP versus minus 54% in USD. Naturally, both figures would be significantly worse (estimated by 10 percentage points) if they could be calculated on a monthly return basis, but that relative The difference (28 percentage points) - which is what matters here - between the GBP value and the USD value would probably be of a comparable order of magnitude in the case of monthly returns.
What was the cause of the striking deviation between the two curves?
In 1931 and 1932 - the two worst years of the then crash - the US dollar cumulatively appreciated against the pound by a remarkable 47%, which significantly moderated the MDD of the stock market in pound terms during this period.
In the following year, 1933, the dollar depreciated again to the year-end rate of 1930; However, this was only of limited disadvantage for investors who calculated in pounds or another non-USD currency, because the global stock market had now started a sustained recovery path. In 1938 and 1939 the dollar appreciated again. Until 1945 there were no more exchange rate changes between the two currencies (due to central bank intervention). From 1946 to 1954 the dollar appreciated again, so that the world stock market, calculated in pounds, once again increased more strongly in pounds than in dollars until 1954 and in 1954 it was a remarkable 51% higher in pounds than in dollars. [3]
Ergo: For a number of US-specific reasons, the Great Depression hit the USA worse than the majority of other Western countries and than the global economy in terms of the real economy and also in terms of the stock market. Because that was the case, it is simply wrong or stupid to explicitly or implicitly use corresponding USA data as representative of the rest of the world. Anyone who uses US economic data from back then must point out their lack of representativeness for the rest of the world. Unfortunately, this almost never happens. This can be seen as a significant failure on the part of historians, business journalists and finfluencers.
Other aspects that put the “crash of the century” into perspective even more
At the end of our analysis, for the sake of completeness, it should be added that every calculation of the maximum drawdown on the stock market as well as the “maximum zero return period” (duration of the recovery phase) is somewhat impractical Worst case consideration underlying. Foreign to practice in that it unrealistically assumes that an investor (a) invests his entire assets exclusively in stocks, (b) he invests exactly on the worst possible day and (c) he gives the entire amount in one sum into the market (i.e. not spread over a longer period of time). In every hundred stock investors there will be less than one who meets all three conditions.
Speaking of “only investing in stocks”. Of course, the banal insight was already valid in 1929 that a stock portfolio had a risk-reducing component for most private investors High quality bonds needs to be “tempered” – especially when it comes to family retirement planning. Anyone who had taken this trivial diversification insight to heart during or before the Great Depression would have done excellently. Short-, medium- and long-term US government bonds (or government bonds from other countries with strong credit ratings) were very profitable investments during the global economic crisis due to deflation and the “flight to quality stocks” and were therefore excellent diversifiers for an equity-heavy portfolio. For example, from September 1929 to June 1932 (the downturn phase of the stock market), medium-term U.S. Treasury bonds in USD delivered an almost unbelievable real cumulative return of +43% and from September 1929 to November 1936 one of +79%. The main reason was the “flight to safe investments” that often took place in such phases and thus price gains on these bonds.
You should also not forget that not only stocks, but also... all Asset classes will experience a drastic crash at some point.
A few examples:
In New York, real estate prices fell by 62% in real terms from September 1929 to September 1939 and only reached the price level of September 1929, adjusted for inflation, again in 1960 after more than 30 years (Nicholas/Scherbina 2013).
In France, real house prices fell starting in 1911, falling to an MDD of 88% by 1949 after 38 long years. Then it took another 15 years until the real price level of 1911 (53 years earlier) was reached again.
An even longer slow-motion crash began for Norwegian residential real estate in 1899. After 55 years (1954), real property prices had fallen by a cumulative 57%. It then took another 31 years until the real price level of 1911 (1985) was reached again.
Individual residential properties - and direct investments in residential properties are always individual properties - can and will have even more extreme maximum drawdowns than the asset class because there is no diversification.
Note: The property price indices mentioned do not take into account net rental yields (gross rent minus maintenance costs and insurance).
The real price of gold in USD plummeted starting in February 1980 and continued to decline over 21 long years until 2001, reaching an MDD of 83%. Taking inflation into account, the February 1980 price peak was not reached again until 43 years later in 2023.
In its short existence since 2009, Bitcoin has fallen by 50% or more (in USD) six times (!). On September 30, 2022, the cryptocurrency was almost 70% below its previous peak eleven months ago.
Conclusion
This blog post was intended to show that the oft-circulated fear numbers about the “horror crash” of 1929 – a maximum drawdown of 89% in June 1932 and 25 years to full recovery – are misleading and false. Simply eliminating or avoiding two very simple errors (omitting dividends and calculating in nominal terms) reduces the actual MDD to 79% and shortens the recovery period from 25 to seven years.
If you go two analytical steps further - i.e. analyze it global, instead of just the US stock market and “for a change” don’t just calculate in US dollars – then the values in question will continue to improve and to a considerable extent.
The question remains why the financial industry - banks, asset managers, investment advisors - as well as the majority of financial journalists and financial influencers are doing little to correct the exaggerated horror story about the 1929 crash.
There are probably two reasons for this. Reason #1 concerns the financial industry. She does next to nothing to correct the horror legend because the idea of a horror crash is good for her business. Representatives of the financial industry love to tell their customers "Dear investor, look how bad it was in 1929! If you still want to invest in stocks - the most profitable of all asset classes in the long term - then you need experts like us. We can protect you from a disaster like 1929 with our actively managed financial product ABC (or our active investment strategy XYZ)."
Reason #2 concerns financial journalists and finfluencers. You can increase circulation and click numbers with the story of the 1929 stock tragedy. Bad news, shock stories and scaremongering sell best. Of course, for some, banal ignorance is the reason why fake news spreads.
Of course, there will also be serious stock crashes in the future. We have about the worst in the last 120 years here and here and here reported. The general pattern of such crashes, which can be deduced from extensive historical experience, looks something like this: (a) The world stock market experiences a collapse of the order of between 40% and 60%, which lasts over one to three years. (b) This is followed by a slower recovery period (which appears erratic and uncertain in real time) for buy-and-hold investors, lasting between one and six years.
The Great Depression Crash, if calculated correctly, essentially fits this basic pattern.
No other asset class produces higher long-term returns than stocks. These returns are primarily risk premiums – the reward for bearing asset class risk. Asset class risk in stocks primarily consists of general volatility risk and crash risk (drawdown risk).
Anyone who invests in a disciplined manner in a globally diversified stock portfolio on a buy-and-hold basis can almost certainly expect to reap these returns for themselves based on the experience of the past 250 years with countless crises that were just as severe or more severe than the current one - despite and because of these crashes.
In order to be able to deal with stock crash risk mentally and in terms of liquidity, a correct knowledge of stock market history is helpful. We wanted to contribute to this with this blog.
Endnotes
[1] Roosevelt ruled until April 1944, when he died, but from the time the United States entered the war in late 1941, U.S. economic policy naturally changed dramatically. Ultimately, Americans were so disillusioned with Roosevelt's 12-year reign that in the early 1950s a constitutional amendment was passed that limited a U.S. president's term in office to eight years.
[2] In 1891, Germany was the first country in the world to introduce statutory pension insurance (initially only for men). The GRV in the USA (called Social Security) was created in 1935 as a reaction to the Great Depression.
[3] Due to the “watered down gold standard” (the “Bretton Woods System”) that existed from 1944 to 1971, exchange rates between individual currencies and the US dollar fluctuated only moderately. The fluctuations that occurred were largely controlled by central banks. Exchange rates did not move primarily based on supply and demand, as they do today.
literature
Bernanke, Ben: “21st Century Monetary Policy: The Federal Reserve from the Great Inflation to COVID-19”; W.W. Norton & Company; 2022; 512 pages
Ahamed, Liaquat: “Lords of Finance: The Bankers Who Broke the World”; Penguin Press; 2009; 576 pages
Nicholas, Tom/Anna Scherbina (2013): “Real Estate Prices During the Roaring Twenties and the Great Depression”; In Real Estate Economics; 2013; 41; No. 2
Selected examples of publications that falsely claim that it took the U.S. stock market from 1929 to 1954 (25 years) to fully recover from the crash that began in September 1929
Ferguson, Niall (2008): “The end of prosperity”; In: Time Magazine, October 2, 2008. Internet reference here ➡ Ferguson may be the world's best-known living historian. He teaches at Harvard University in the USA.
Müller, Dirk (2018): “Powerquake: The world facing the greatest economic crisis of all time – background, risks, opportunities”; Heyne Publishing House 2018; 350 pages, questionable passage: p. 253 ➡ Müller is a fund manager and author.
Handelsblatt (2020): “The predictions of crash prophets really are that realistic”; Article by Frank Wiebe, February 4, 2020. Internet reference here ➡ The author is a business journalist.
Roberts, Lance (2021): “Bear Markets Matter More Than You Think”; In: Advisor Perspectives, June 4, 2021. Internet reference here ➡ The author is a financial advisor in the USA.
Surz, Ronald (2024) “Baby Boomers Better Get Out Of The Stock Market Now”; Seeking Alpha; July 21, 2024; Internet reference here ➡ The author is a financial advisor in the USA.
Der Kurier (2020): “After the big crashes: This is how long it took to recover”; March 28, 2020; Internet reference here ➡ Der Kurier is an Austrian daily newspaper. The author is a business journalist.
Wikipedia (2022): Both the German Wikipedia (article “Black Thursday” – Internet reference here) as well as the English one (article “Wall Street Crash of 1929” – Internet source here) cite 1954 as the year until the Dow Jones Index fully recovered, but do not point out the underlying incorrect or misleading measurement that we describe in this blog post (“Error 1” and “Error 2”).