
From Gerd Kommer and Praval Kapoor
After the excellent years for stocks in 2023 and 2024, there have been significant losses in stocks in the three and a half months since January 2025. Some other asset classes, including Bitcoin and long-term bonds, also fell. Table 1 gives an overview:
Table 1: Returns on selected asset classes and individual investments from January 1st, 2025 to April 11th, 2025 (100 days) – in euros
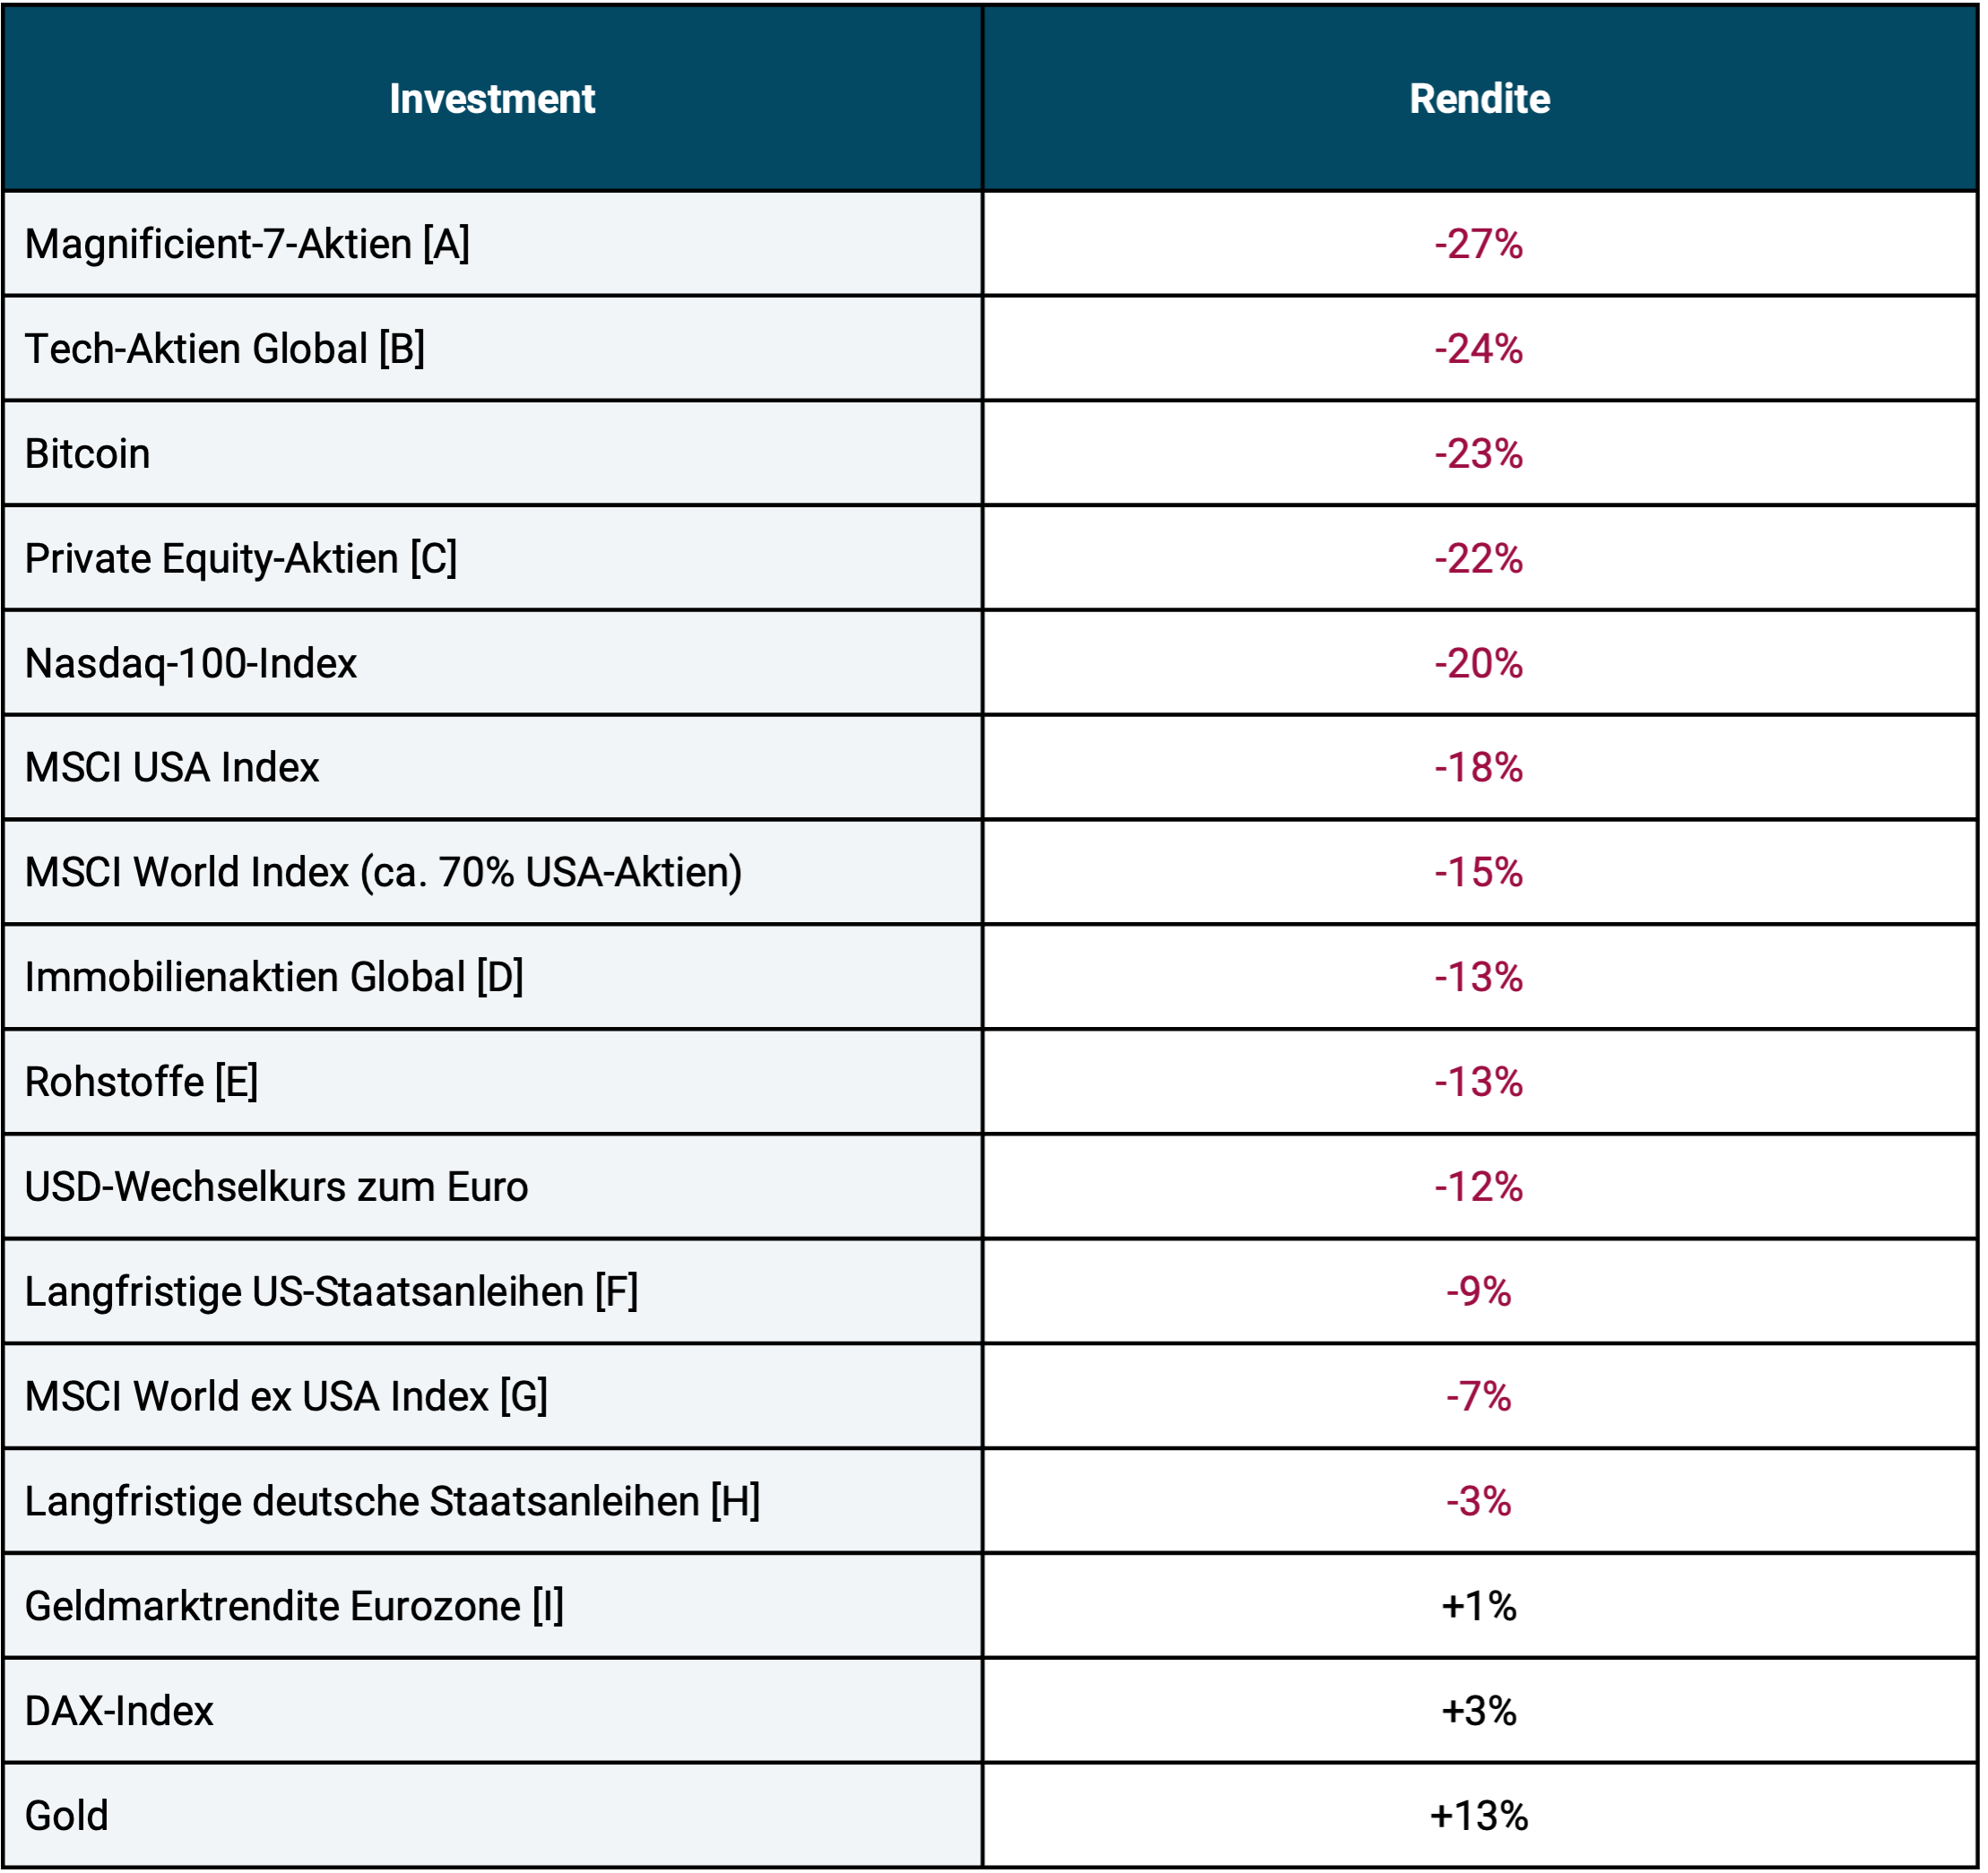
► All numbers rounded to full percent. ► [A] Amazon, Apple, Meta/Facebook, Microsoft, Nvidia, Google/Alphabet, Tesla. ► [B] MSCI World Information Technology Index. ► [C] S&P Listed Private Equity Index (shares of the world's 30 largest private equity firms). ► [D] FTSE EPRA/NAREIT Developed Dividend+ Index. ► [E] S&P GSCI TR Index. ► [F] US government bonds with a remaining term of approximately 19 years (Bloomberg Barclays U.S. 10+ Year Treasury Bond Index).► [G] Industrial countries excluding the USA. ► [H] German government bonds with a remaining term of approx. 19 years (Deutsche Börse EUROGOV® Germany 10+ Index). ► [I] ESTR interest + 0.085% (overnight money equivalent).
The slump was triggered by the US government initiating a “trade war” when it announced high import tariffs for goods from countries with which the US has a trade deficit at the beginning of April 2025. [1] According to current information, the US tariffs will not take effect until July 2025. They are already in force for China, but here too, some product categories that are important for the USA are initially exempt from import taxes.
In response to the tariff announcement, the affected countries are likely to impose similarly high tariffs on American goods. However, how this dispute will end in detail in the final and long term is still unclear at the moment. It cannot be ruled out that the Trump administration will have to mitigate the announced tariffs in the next few months, as there are signs of damaging effects on the US economy, including an increase in long-term interest rates that will make servicing the high US national debt and private real estate debt more expensive. [2] negative impact on the US stock market (65% of all US households own stocks) and a potential spike in inflation. Long-term interest rates in the euro area also rose.
What is often missing from the media discussion of the stock market collapse, however, is that two sub-segments of the global market - US stocks from a regional perspective and tech stocks from a sector perspective - were very highly valued, i.e. "expensive", due to their well above-average returns in the 10+ years up to the end of 2024 before the collapse. In contrast, in the stock market segments “World ex USA” and “World ex Tech” there was a normal and in some cases even favorable valuation at the end of 2024.
The particularly large losses for US stocks and tech stocks seen in Table 1 could therefore be the start of a gradual correction and return to more normal valuations. A return triggered by, but not fundamentally caused by, the current wave of protectionism. Naturally, a complete correction in the form of an even stronger or long-term relative under-return of Tech and the USA compared to the rest of the stock market may still be some time away. (We have the fact that tech stocks have not historically had systematically higher returns than the general stock market and there is no really convincing reason to assume a permanent excess return in the future here shown.)
How to react now?
The question now arises: How should private investors react to the new situation and to any losses in their own portfolio?
With regard to stock portfolios that are broadly diversified across the main sectors and countries, this unpleasant phase will probably ultimately confirm that buy-and-hold is more profitable than active market timing, for example by reallocating parts of the stock portfolio into risk-free interest investments or by “swapping” stocks or stock market segments that are now perceived as unattractive into supposedly more attractive ones.
As an investor in a situation like the current one, it cannot be made clear enough that consistent buy-and-hold, combined with broad diversification and rule-based rebalancing, is the smartest investment strategy in the long term. The best way to do this is to look at hard numbers. The financial analysis firm Standard & Poor’s provides this in the form of its latest, semi-annually updated “SPIVA” analysis of the performance of actively managed investment funds. [3] Almost without exception, active equity funds practice moderate to very strong deviations from buy-and-hold. For the vast majority, it is explicitly part of the investment strategy to try to mitigate losses in “down phases” in the market through timing, i.e. “in-out”/“back-and-forth”.
How well does active investment management work?
Tables 2 and 3 below summarize some of the results from the latest SPIVA analysis of actively managed equity funds that have their legal seat (their “domicile”) in the EU and are distributed across the EU.
Table 2: Proportion of actively managed equity funds domiciled in Europe that underperformed their passive index benchmark for different periods of time
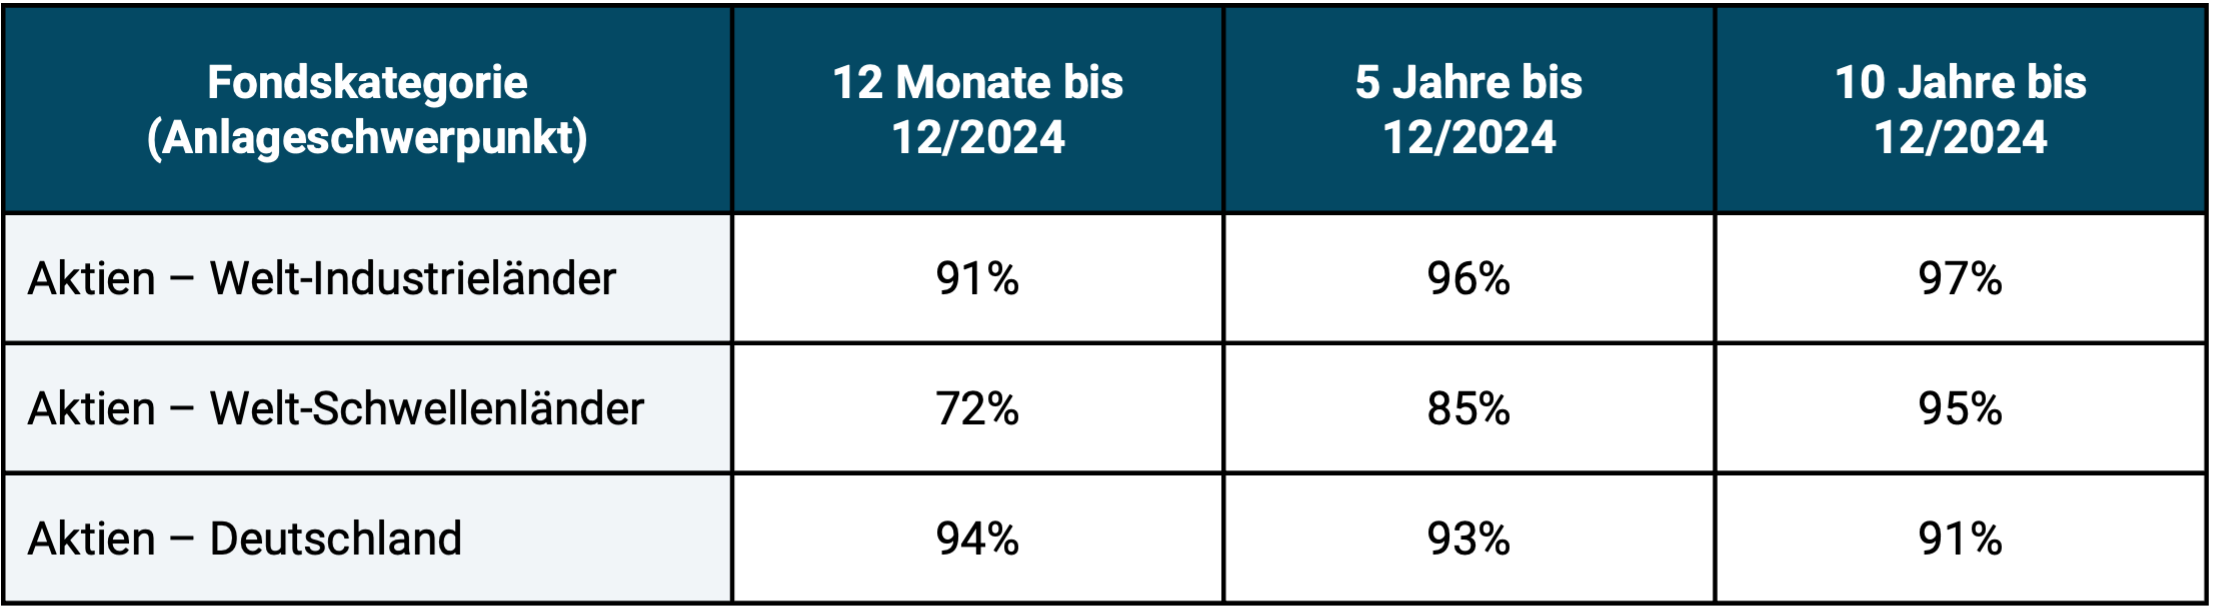
► Source: S&P Dow Jones Indices “SPIVA Europe Scorecard Year End 2024”. ► Original data rounded to whole numbers. ► Without taking into account costs in the passive benchmark, but also without taking into account costs for any issue charges for the actively managed funds. Index funds/ETFs are not included in the underlying data set. Legally, all funds are UCITS funds (mutual funds).
Table 2 shows that the vast majority of active equity funds underperform a passive, buy-and-hold index benchmark that can be easily implemented via ETFs.
Table 3 is based on the same fund data as Table 2, but instead of showing the rate of active underperformers, it now shows the average fund return of all active funds and contrasts this with the return of the respective passive index benchmark.
Table 3: The average returns of European-domiciled, actively managed equity funds and the returns of their index benchmark for the 5-year and 10-year periods
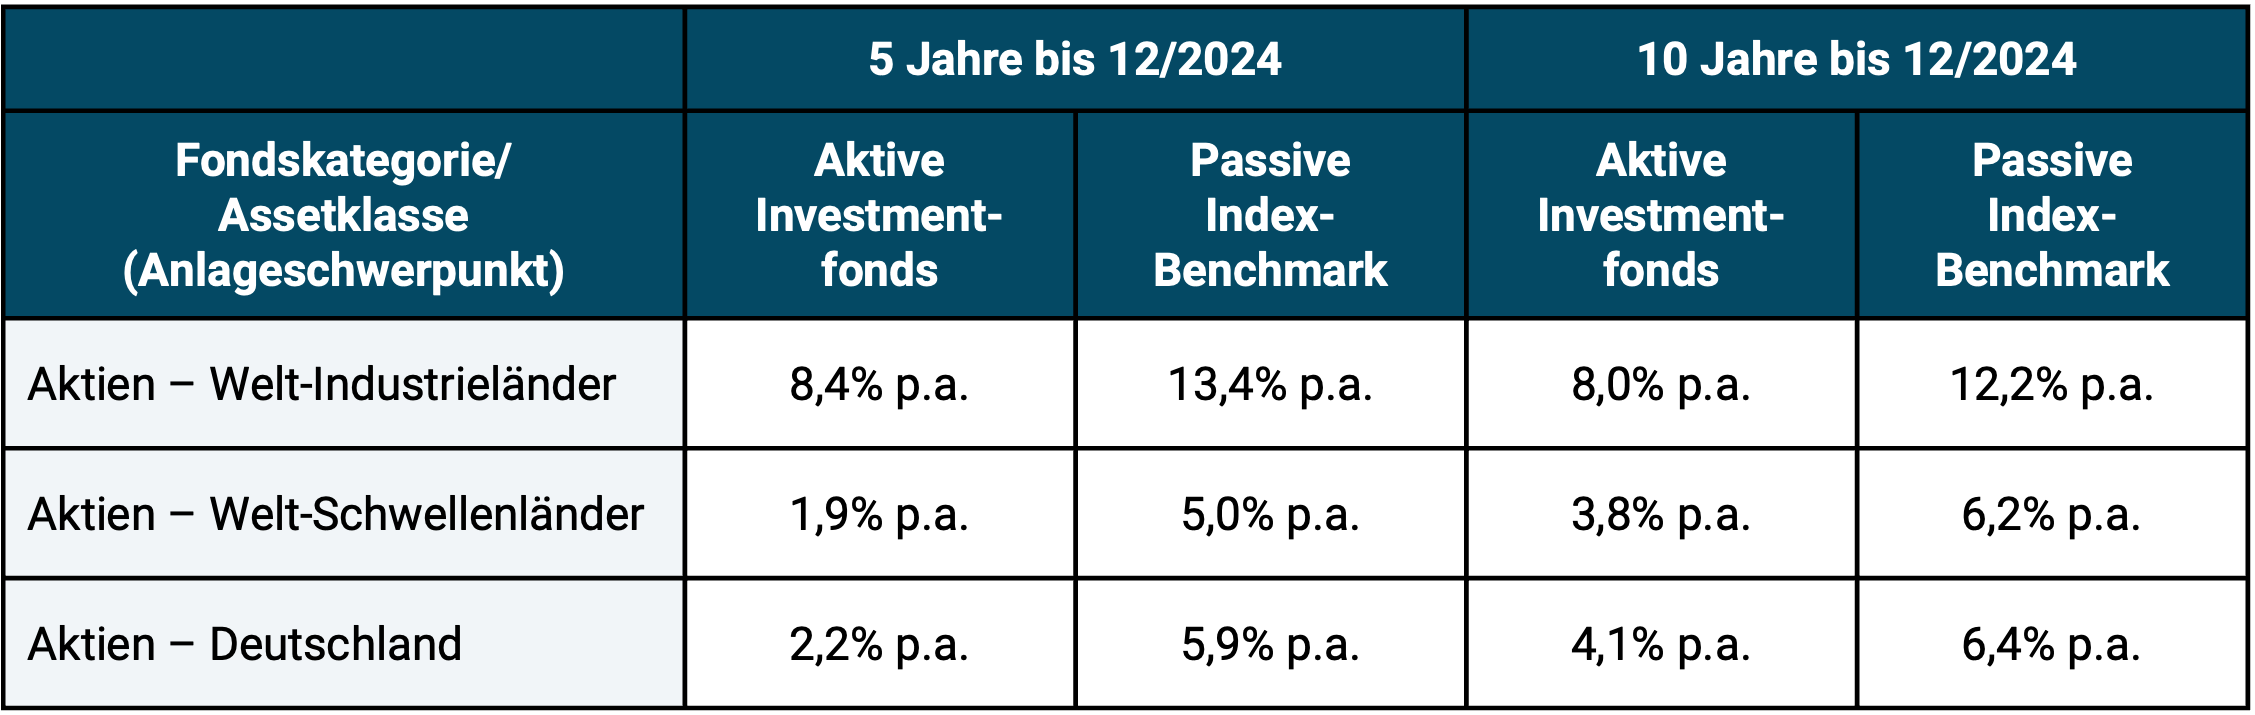
► Source: see Table 2. ► Without taking into account costs in the benchmark, but also without taking into account costs for any issue premiums of the actively managed funds. ► Fund returns based on simple averages (“equal weighted”). ► Further comments: see Table 2.
Now someone might argue that the underperformance of most active funds ultimately doesn't matter because this problem can be avoided by simply picking one of the few outperforming funds. Even if only one percent of all funds belonged to this winning group in the long term, this option is possible.
Unfortunately, this conclusion, which seems obvious at first glance, is misleading. The small group of active “non-loser funds” changes in composition from one observation period to the next in a way that cannot be predicted. The time window can be a specific calendar year, the last ten years, the 20 years from 1996 to 2015, or any other conceivable time period.
If you choose the “right” time window in retrospect, almost every investor and every fund manager will have been at the top or far ahead at some point. Unfortunately, this doesn’t help an investor for the future or for the “entire period”. It would only help if there was a sufficiently high level of “performance consistency”. However, this is not the case as Table 4 shows.
Table 4: Performance continuity: How many of the “top quartile funds” (top 25% of all actively managed funds) from the starting year 2019 managed to remain in the top quartile in the following years?
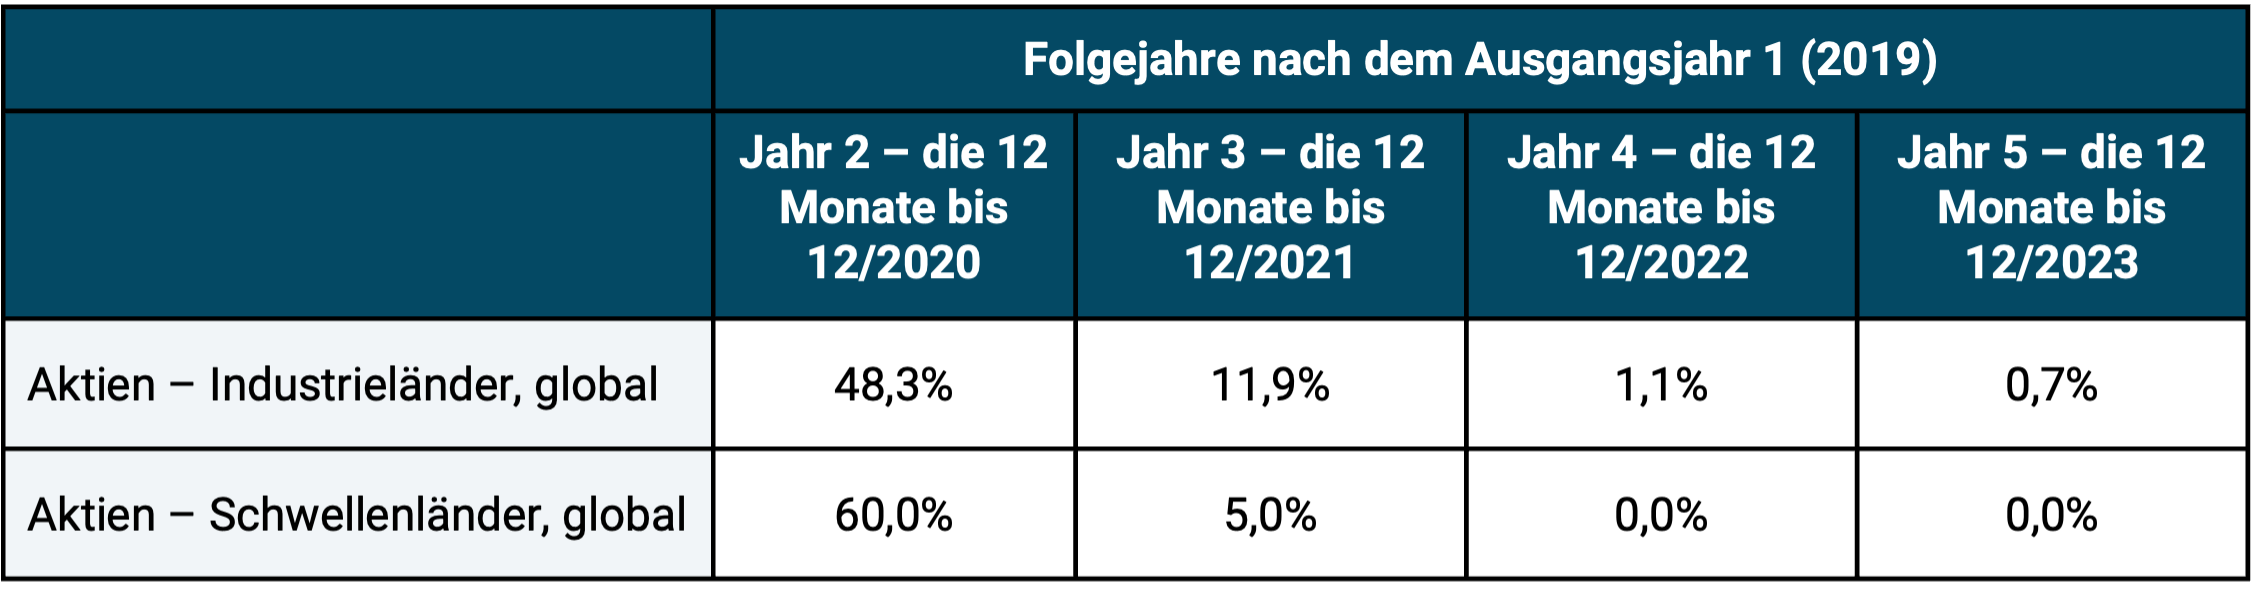
► Source: S&P Dow Jones Europe Persistence Scorecard 2023. ► The funds examined are UCITS equity funds domiciled in Europe. ► Persistence Scorecard 2024 not yet available at the time of writing.
To interpret the data in Table 4: The two rows of the table show the percentage of active funds that formed the top quartile of all funds for the asset class in question in the base year 2019 (Year 1) (the 25% of all funds with the highest return in 2019) and that continued to be in the top quartile continuously thereafter. In the year 2020 following the initial year 2019 (year 1), the percentage of funds that were in the top quartile in year 1 and year 2 is given, in year 3 the funds that remained in the top quartile continuously in all three years, etc. The proportion of these “continuous winning funds” decreases from year to year.
No stability of returns for actively managed funds
Overall, Table 4 shows that there is little consistency (persistence/continuity) in the performance of actively managed investment funds. If performance was completely consistent, all cells in the table should say “100%” because the top quartile funds from the previous year were also able to maintain their membership in the top quartile in the following year without exception. If remaining in the top quartile from the first subsequent year (here 2020) were a completely random process, the series of numbers would look like this: Year 2: 25.0%, Year 3: 6.3%, Year 4: 1.6%, Year 5: 0.4% (each rounded). In other words: the actual performance consistency is poor and is only marginally higher than that which would be achieved by chance alone. This is an indicator (although not proof) that (unpredictable) chance is the cause of the funds in question's long-term outperformance.
Similar research has been conducted by scholars over the past 30 years for other types of actively managed retail investor portfolios, e.g. B. those in which a bank or an asset manager manages the portfolio and those in which the private investor invests on his own initiative, as well as for hedge funds and private equity funds. Although SPIVA-like studies are carried out less frequently for such other types of actively managed portfolios because compiling the underlying return data outside the UCITS fund world (normal investment funds) is more complex, the basic results are identical. In summary and only slightly simplified, they look like this:
1) Passively managed portfolios beat the majority of all correctly comparable actively managed portfolios.
2) The winning rate (according to Table 2) of the passive portfolios increases with the length of the evaluation period and approaches the 100% mark over periods of 10+ years.
3) Investing in the small minority of active outperformer funds or strategies is probably pointless, as their composition changes from time window to time window and cannot be reliably predicted forward. The probability that a fund from quartile 2 or 3 will end up in the top quartile in the next period is just as high as the probability for original quartile 1 funds. (Only for Quartile 4 funds, the worst of all funds, does there appear to be a certain tendency to persist - presumably because these funds tend to coincide with the group of the most expensive funds.)
4) From statements (1), (2) and (3) it follows that the probability or frequency-weighted return of active investors is lower than that of passive investors. In other words: passive investors mostly beat active investors in the short term and over 90% beat active investors in the long term.
This result has been confirmed again and again by research over the past 50 years. [4] Its two main causes are:
a) The “information efficiency” of the capital markets: With publicly available information, it is apparently hardly possible to generate a reliable return advantage over the market after costs, taxes and risk, because this information is probably already fully priced in at any given time.
b) The “arithmetic of active investment management”. According to this idea, formulated by Nobel Prize-winning economist William Sharpe, it is mathematically necessary that at least 50% of all actively managed portfolios produce worse returns than correctly comparable passively managed portfolios due to their higher costs. (The details of this are explained in Gerd Kommer's investment books, e.g. in this one.) [5]
Good risks versus bad risks
Returns are primarily risk premiums, i.e. compensation for bearing so-called “good” risks. Good risks must be distinguished from bad risks. An example of bad risks is individual value risk, for which the capital market does not provide reliable return compensation. In other words: Individual investors do not achieve higher overall returns than diversified investors, but do have to endure higher volatility and greater drawdowns.
The fluctuation risk of asset classes (volatility and drawdown risk) falls into the category of good risks. Anyone who wants to sustainably “harvest” the high returns from the equity investment class will probably only be able to do so if they “take on” this fluctuation risk. [6] – allows the risk, so to speak, to materialize in one's own portfolio from time to time. The famous investor and author André Kostolany (1906 - 1999) formulated this fundamental law with a beautiful and clever quip: "If you don't have stocks when they fall, you won't have them when they rise."
When the current episode will have entered the capital market history books in a few years and its market data will be included in the available SPIVA studies, then we will most likely see again that buy-and-hold was the superior strategy in 2025.
And another legendary stock market quip will then also have been confirmed once again - just as it has been countless times before in the last 125 years: "The five most dangerous words in investing are 'This time it is different.'" [7]
There have been a large number of phases of extremely high uncertainty in the markets since the beginning of the 20th century and before that, and of course there have been a number of crises and crashes that were much worse than the current one can reasonably be expected to be due to a sudden increase in protectionism. Think of the first and second world wars. In the course of these two ultimate conflicts and crises, tariffs were also dramatically increased by many countries.
By the way, one might consider it a curious irony of history that this protectionism initiated by a conservative politician is nothing other than the partial dismantling of the “globalization” that has traditionally been passionately hated by the left half and part of the right half of the political spectrum. Motto: Back to “Buy local”.
The resilience of globally diversified portfolios
Either way, a globally diversified stock portfolio on a buy-and-hold basis has proven to be surprisingly resilient in all serious historical crises. Resilient here primarily means more profitable than the vast majority of actively managed portfolios, more profitable than “in-out” and of course far more profitable than interest-bearing bank deposits. That's how it will be this time too.
Anyone who cannot resist the “action bias” programmed into many people by evolution in these “usually troubled” times, [8] He should now carry out a countercyclical rebalancing in his portfolio, i.e. increase the percentage of equity shares in the portfolio, which has fallen due to the recent losses, back to the originally consciously chosen percentage value by reallocating it from the low-risk part of the portfolio. Of course, doing this now requires courage and conviction. If you don't have this, you should simply sit out the current downturn. We have the theory and practice of rebalancing here and here described.
Endnotes
[1] A government trade deficit exists when the value of imports exceeds that of exports in a particular period.
[2] The increase in the current yield for ten-year US government bonds immediately after the tariff announcement at the beginning of April 2025 by around 0.5 percentage points corresponds to an additional interest service of around USD 180 billion per year for the government alone. In general, these interest rates are around 0.2 percentage points higher today than when Trump was elected on November 5, 2024, while Trump is energetically campaigning for lower interest rates.
[3] The abbreviation SPIVA stands for “S&P Indices versus Active”.
[4] The historically first study that demonstrated the underperformance of the majority of actively managed equity funds was Michael Jensen: “The Performance of Mutual Funds in the Period 1945–1964,” Journal of Finance, Vol. 23, No. 2, 1968.
[5] Sharpe's essay, freely accessible on the Internet, can be understood by any layperson: William Sharpe: "The Arithmetic of Active Management", The Financial Analysts Journal, Vol. 47, No. 1, Jan./Feb. 1991.
[6] That’s why in English it’s clearly said “to take investment risk”.
[7] “The five most dangerous words in investing are: This time it’s different.” This insight is believed to have come from John Templeton (1912 – 2008). Templeton was a famous fund manager, entrepreneur and philanthropist. He died very rich.
[8] See the articles “Action Bias” in the German and English Wikipedia, here and here.