
<<< This blog post is also available as a YouTube video. >>>
From Felix Großmann and Gerd Kommer
On February 20, 2020, 33 days ago, the global stock markets continued Corona crash what we are calling it provisionally, as no common name has yet been established for this stock market collapse. The global stock market, measured by the MSCI ACWI IMI index, the broadest of all stock indices, suffered a loss of 34% from February 20th to March 23rd, and the DAX suffered a loss of 37%.
In this blog post we try to evaluate this severe and rapid collapse against the background of historical data and factual arguments and to place it into a larger picture. Our goal is to contribute to a meaningful, action-oriented interpretation of this development by our readers. We explain seven separate issues and arguments, all of which revolve around the basic question “What to do in the Corona crash?”
This blog post is longer than our blog posts usually are. Given the importance of the topic, we felt it was justified to exceed our regular length limit when writing.
(1) Stocks were, are and will remain the most profitable asset class
Even the Corona crash does not change the old statement that stocks are the most profitable asset class in the long term and also in the future [1] are. In this context, Table 1 compares the historical returns of stocks with those of the other most important asset classes.
Table 1: Real (inflation-adjusted) returns of major asset classes from 1900 to 2019 (120 years) - in USD, before costs and taxes

► Source: Dimson/Marsh/Staunton, BIS Basel, David S. Jacks. ► Residential real estate: total returns from price increases and net rental income. For details see Kommer/Schweizer 2018. This total return (not just price increases) is a population-weighted average of the national returns of 12 countries in local currency and excluding leverage effects. ► Commodities represent the five main commodity groups: energy, precious metals, base metals, minerals and agricultural commodities.
When interpreting the numbers in Table 1, one should pay attention to the relative Differences between the individual asset classes. In this perspective, stocks were twice as profitable as real estate and six and a half times as profitable as interest-bearing bank deposits. The relative advantage of stocks over residential real estate and interest-bearing investments is likely to be even higher in the next few years, as the “Global Stock” asset class is currently cheaply valued, while bonds and residential real estate (at least residential real estate in the DACH region) are particularly expensive today. (Nota Bene: A low interest rate level is synonymous with a high valuation of bonds.)
“Packaged” financial products or “active” investment strategies such as endowment life insurance, certificates, P2P loans, investments in closed funds, hedge funds or private equity funds deliver statistical results due to the high open and hidden costs they incur and for other reasons lower returns than the underlying asset classes in which they invest, while the risks of these financial products are naturally at least as high as those of the relevant asset classes, even if the daily or monthly volatility of the packaged products is not observable due to the lack of a stock exchange listing.
Not only have stocks been the most profitable asset class over the last 120 years, as shown in Table 1, they were also the decade immediately before the Corona crash began. This decade (2010 to 2019) was a well-above-average profitable period for a buy-and-hold investor with a globally diversified stock portfolio. The world stock market delivered extraordinarily high returns in the said ten years, viz real 10.7% p.a. (cumulative 177%). It therefore outperformed the DAX (6.8% p.a.), gold (4.6% p.a.), German residential real estate (4.4% p.a.) [2] and bank balances (negative 1.1% p.a.) (all returns adjusted for inflation, in euros, before costs, before taxes).
(2) Market timing is harmful – even in a crash
The returns on stocks cannot be reliably predicted in the short and medium term. You follow a so-called “random walk”. This fact is completely undisputed in economic research (a summary of the state of research on this is provided by Jacobs/Weber 2016). The main reason for this unpredictability is the high Information efficiency [3] the capital markets, especially the stock market. This feature makes capital markets unique among all markets. Because stock returns cannot be predicted in the short and medium term, it is generally and even in a crash situation not only pointless, but on average detrimental to returns to buy and sell on the basis of forecasts. The fact that the established financial industry and the media traditionally suggest something completely different to their audience primarily results from their conflicts of interest and the much higher margins that financial service providers achieve by marketing this error. Our own gut feeling, our emotions and common sense also lead us in the harmful direction of trading based on events and moments. By the way, common sense and our instincts lead us astray on numerous economic questions (Watts 2011).
The harmfulness of active investing in stocks and especially Market Timing (In-Out over Time), including “crash market timing,” has been literally studied to death in empirical studies by university economists over the past 50 years or so. In one sentence: There is no convincing evidence that such timing strategies produce more attractive long-term returns than disciplined buy-and-hold when taking risk, costs and taxes into account. The opposite is the case. In the Investment books Kommer summarizes the results of many of these studies. In March 2019, we ourselves developed a specific, intuitively plausible timing strategy for “Crash timing"tested. Here too, the statistical inferiority to buy-and-hold was evident.
The utility of “downside hedging” – the conscious attempt to “downside” the volatility (intensity of fluctuations) of a portfolio using derivatives (e.g. put options) or stop-loss orders [4] Limiting this has also been examined many times. This type of strategy, which may seem tempting at the moment, is equally subject to buy-and-hold. A summary of scientific studies in which this issue was examined can be found in Kommer, 2018, p. 148 ff.
Incidentally, upon closer consideration, it quickly becomes clear that almost all active investors - private investors and professional investors - consciously or unconsciously practice downside hedging in one of its many variations. In this respect, the majority of the uncountable general scientific studies that have shown the inferiority of active investing over the past 50 years or so are also a refutation of the benefits of downside hedging.
If these theoretical and statistical arguments from science are not convincing, you might like to simply look at the share price of Berkshire Hathaway, Warren Buffett's company, find instructive. Since February 20, 2020, Berkshire has suffered only a moderately smaller share price decline than the overall US market (29% versus 35% - in USD nominal). Even in the great financial crisis starting in 2008, Berkshire fell almost as deeply as the general US stock market (45% versus 50%). Berkshire's long-term returns over the last 10 years or so have also been fairly close to that of the broader U.S. market. If even “the greatest living financial investor” apparently cannot avoid a crash, then one may ask why anyone should believe that this is possible for other stock investors other than through luck.
(3) Learn from history
In order to adequately understand the implications of the Corona crash, it is also worth taking a look at the history of stock market crises. Table 2 therefore summarizes some key figures on the six largest stock market declines in the last 120 years.
Table 2: Selected key figures for the six declines in the global stock market between 1900 and 2019 with a maximum cumulative loss (maximum drawdown) of 45% or more in real terms
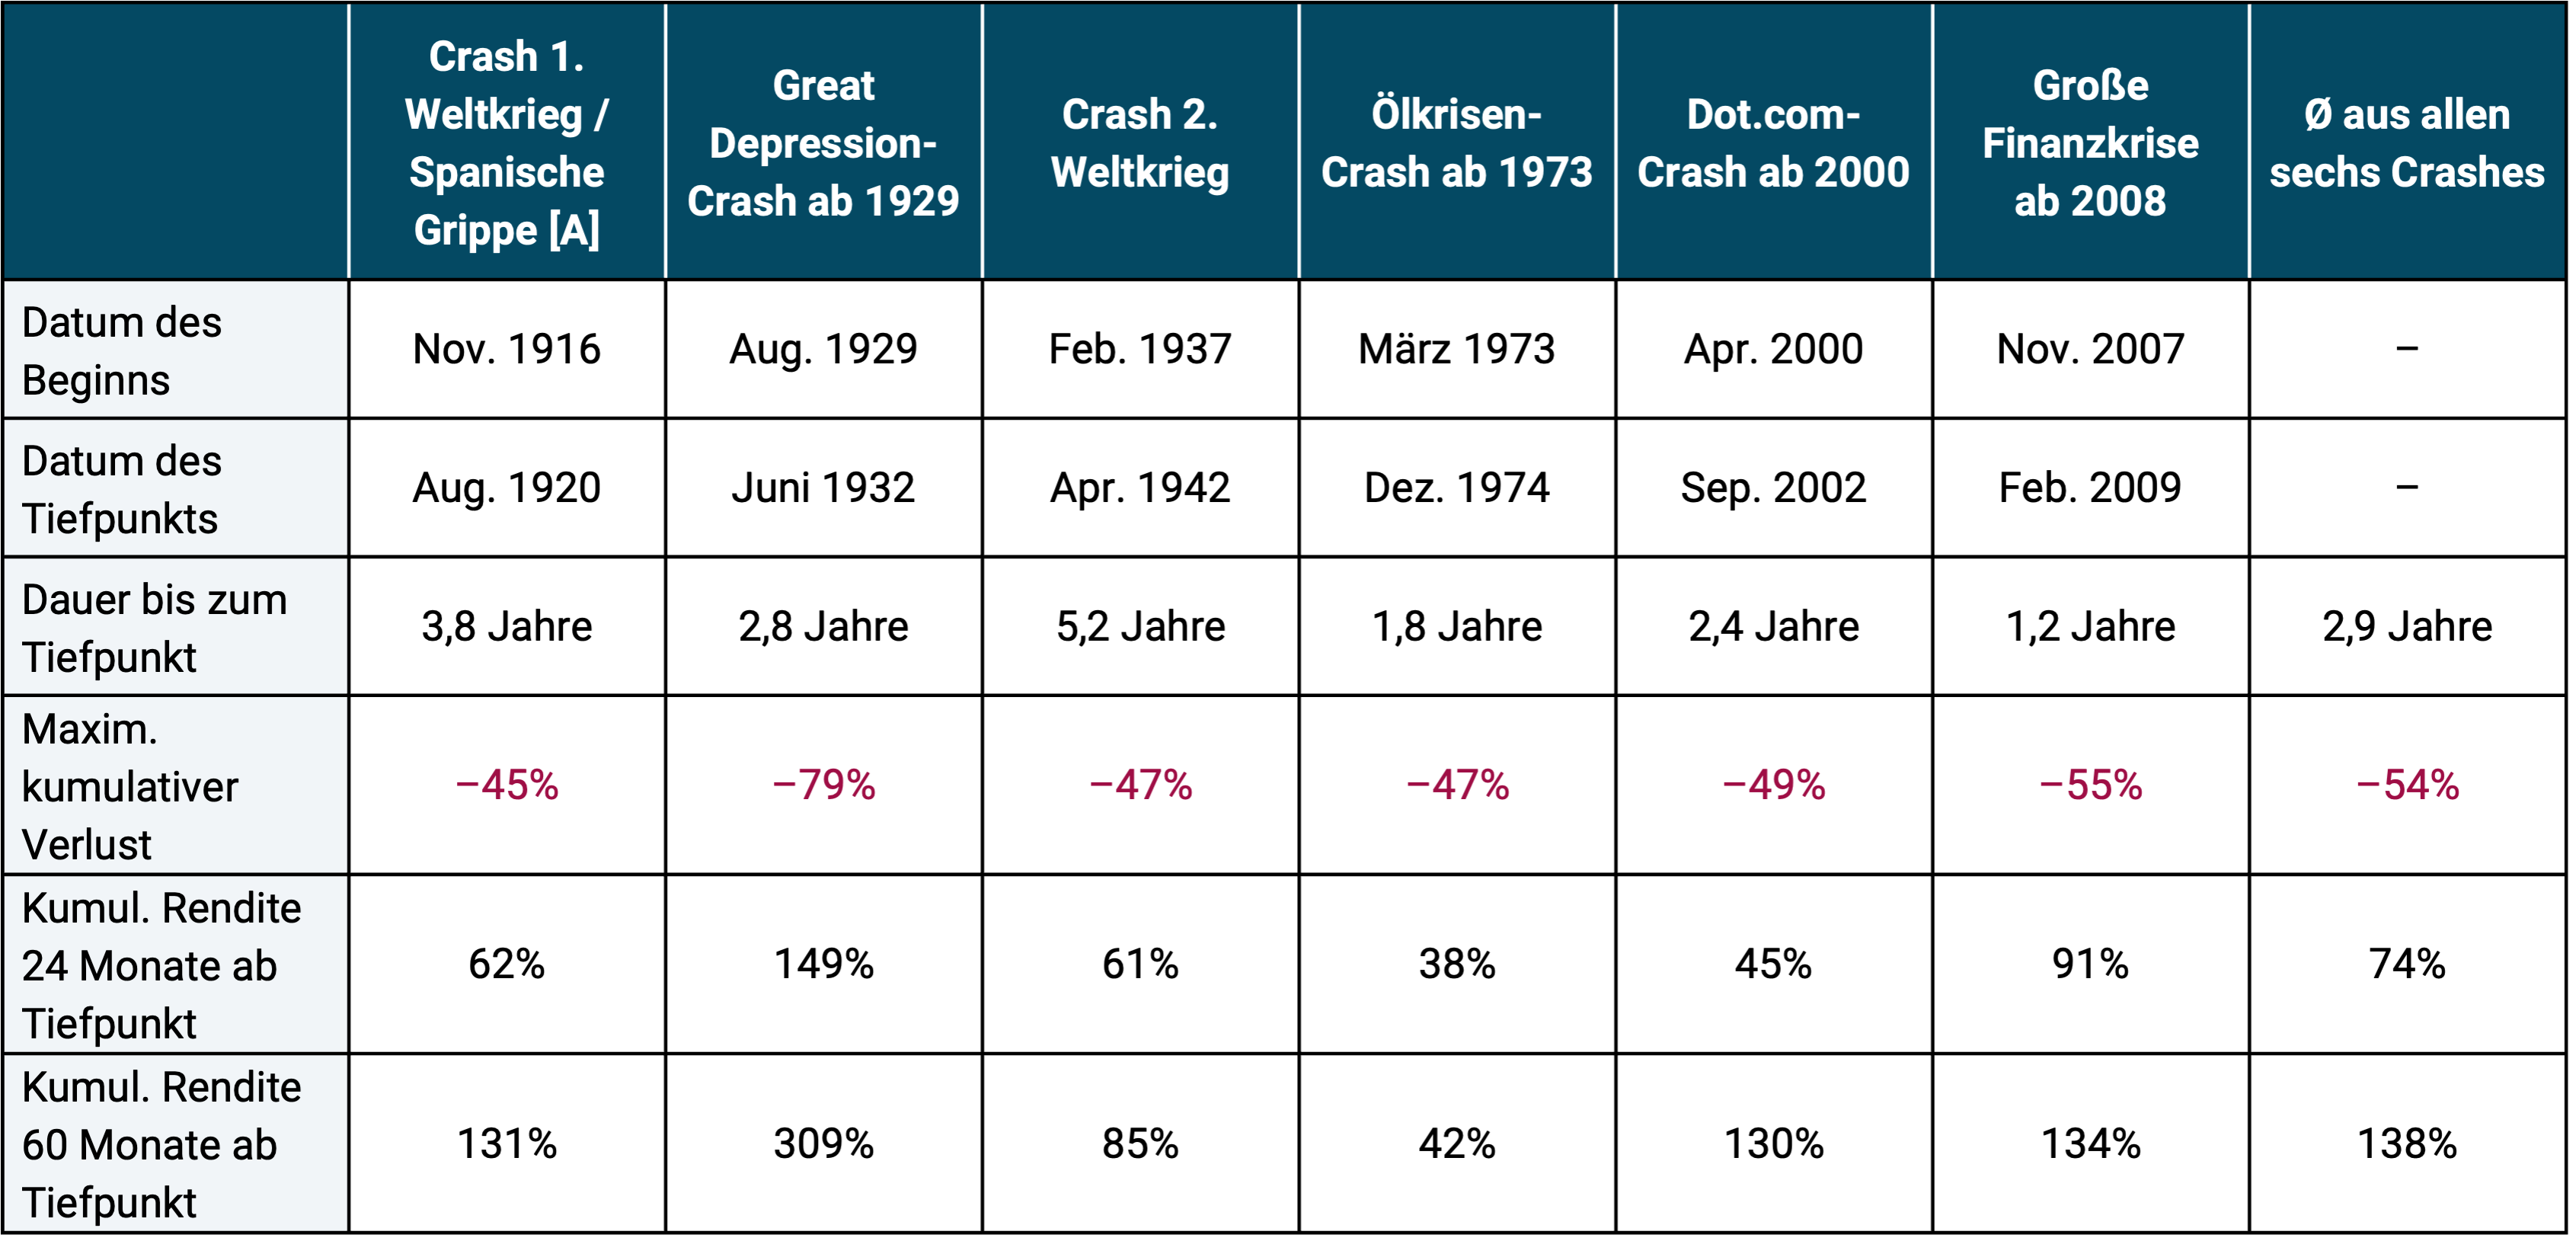
► Underlying data: US stock market in USD, adjusted for inflation from 1900 to 1969 (S&P Composite Index 1900 to 1926, CRSP1-10 Index 1927 to 1969), as no monthly returns are available for the world stock market before 1970. 1970 to 1987 MSCI World Standard Index, 1988 to 1995 MSCI ACWI Standard Index, 1996 MSCI ACWI IMI Index. ► [A] Spanish flu: From January 1918 to December 1920, what was probably the most devastating global pandemic in modern history raged. It is estimated that around a quarter of the world's population became infected. Estimates of the number of deaths range from 17 million to 100 million (English Wikipedia).
Table 2 illustrates that severe stock market declines over the past 100+ years in the United States (up to 1970) and worldwide (from 1970) were not all that rare - there were six of them, including one during a dramatic pandemic. If the filter criterion had been chosen a little “softer” (e.g. minus 30% instead of minus 45% slump), then there would have been more than six stock market crises.
The data shows that even in these brutal bear markets, the recovery from the trough did not occur in short periods, but in each case it occurred in manageable periods.
The most comprehensive historical-statistical study on stock crashes to date was published by the American and Chinese economists Goetzmann and Kim in 2018 (Goetzmann/Kim 2018). The study includes empirical data on stock market crashes in national stock markets spanning four centuries. The results of the two researchers confirm the conclusions drawn from the six cases analyzed in Table 2.
In general, from today's perspective, there is no convincing reason to assume that the recovery in the Corona crash from the low point will fundamentally deviate from the general pattern in Table 2, i.e. will take significantly longer than the average of these six crashes - even if that contradicts our intuition at this moment. The famous fund manager John Templeton made the statement “The four most dangerous words in investing are, ‘this time it’s different’”. For us, this is one of the wisest stock market quips ever. As far as the action-related implications of the Corona crash are concerned, they are not fundamentally different from those from previous crashes, which are summarized in Table 2.
(4) Other asset classes are also not immune to Corona
To believe that only the returns of stocks and not those of other risky asset classes with fundamentally attractive return potential (because return and risk necessarily depend on each other) will be affected by the Corona crisis would be or is extremely naive. By “other asset classes” we primarily mean real estate (residential, commercial), unlisted company investments, high-yield bonds, undeveloped land, collector’s items and of course all “packaged” financial products that are based on these asset classes – ultimately almost everything, with the exception of short-term bonds with the highest credit ratings. For the vast majority of unlisted asset classes, Corona-related negative returns and impairments will also become visible over time, at least for those owners/investors who “look”. On the special case Bank balance we will address argument 5 below.
A plausible leading indicator of what will happen in the German residential real estate sector in the short and medium term future are the share prices of the two largest apartment landlords in Germany (Vonovia SE, Deutsche Wohnen SE). The prices of the two stocks fell 23% and 24% from February 20 to March 23. As we published in a 2018 Blog post have shown that there is no fundamental economic difference between the risk of real estate when it is held by listed companies and the risk of direct real estate investments. The share price of listed real estate companies shows in particular how the effect of the Corona crisis is on the Equity capital of the investor in the property (in contrast to the effect on the mere property value). If - as is to be expected - the German-speaking countries and the rest of Europe go through a sharp recession in the next few months, i.e. the demand for consumer and capital goods falls significantly and unemployment and company bankruptcies increase, rent losses will increase dramatically. As a result, real estate valuations or prices will probably fall - all the more so since residential real estate in the major cities of the DACH countries tends to be at “bubble level” today.
Regarding investments in unlisted companies: Why should the general economic laws work differently for unlisted companies than for listed ones, i.e. shares? Only a fool will consider the fact that you can observe the fluctuations in the value of stocks in real time every day in real time, but not for unlisted companies, as a real, rather than an apparent, difference in risk. The underlying reality is of course the same for listed and unlisted companies and this reality will become visible at the latest in the event of a sale of such a company stake.
(5) Out of stocks now and into bank deposits – does that make sense?
Those equity investors who now sell their shares out of concern and then leave the proceeds in a bank account are exchanging “Risk A” (the risk of further losses in share prices) for the perhaps greater “Risk B”, i.e. the possibility of losing a significant portion of the proceeds should the bank in question slide into insolvency. This risk only does not exist if the cash amount in the bank account falls below the state deposit insurance limit (100,000 euros per customer-bank combination in the EU; there is no federal deposit insurance in Switzerland).
Although no one can reliably predict when the next banking crisis will come, there is no question that one will happen again at some point. Individual banks can also go bankrupt due to self-inflicted mistakes even outside of a systemic banking crisis. We have one on the topic of banking risk 2019 Blog post which presents these risks and their causes in more detail. Basically, bank balances above the state deposit insurance are nonsensical investments in terms of both return and risk, unless the money is only temporarily parked in the account for a few weeks. This insight is true today and it was true 10 or 20 or 50 years ago. More recently, a growing portion of the private investing community appears to be realizing this actually banal fact.
(6) Are stocks a buying opportunity right now?
If you ask yourself “how should I react to this crash in the short term?” The comparison of two different private investors, who represent two different starting situations, could be instructive: Private investor Sven has had a globally diversified stock portfolio for a long time and, on March 23rd, looks with great concern at the current drastic book losses (-34%) in his portfolio, which have accumulated since February 20th.
Investor Charlotte has been toying with the idea of such a stock investment for years, but has repeatedly postponed this step for various reasons. Your liquid assets are therefore still completely invested in cash. At this moment, Charlotte is happy about her long-standing hesitation, which had often annoyed her in the past.
Sven and Charlotte are both 45 years old and have the same total assets. Their net incomes are also identical. After the current stock slump, Charlotte sees the stock market as an attractive buying opportunity and is now in a hurry for the first time in years. the Part of her liquid assets, which she had long planned to invest in the asset class stocks, would soon be invested. She wants to be invested before the “sale” ends again. In doing so, she accepts - soberly as Charlotte is - the fundamental possibility that the stock market could become even cheaper immediately after her investment before it turns upwards sustainably. [5]
Unlike Charlotte, Sven is frustrated, even depressed. He is considering whether he should sell his shares now in order to limit his drawdown since February 20th to at least minus 34%. He remembers the saying “it is better to have an ending with horror than a horror without end”.
Which of the two acts more rationally and wisely? From an economics perspective, the answer is simple: Charlotte. She knows and accepts that stock prices cannot be predicted in the short and medium term - not even at this moment, that stocks are now valued rather cheaply and therefore have a noticeably higher "expected return" in the future than they did on February 20th.
Sven's losses since the start of the Corona crash are - in economist jargon - "sunk costs" [6] and therefore, from a purely rational perspective, play no role in future decisions. Difficult to understand and digest, but that's how it is. For Sven, too, the expected return on shares at this point is higher than it was a month ago and if he were not sitting on a big book loss, he would - this often occurs to him - find the current price level, like Charlotte, an attractive entry level.
From a purely factual and rational perspective, however, both Charlotte and Sven should think and act identically, just like Charlotte. Gut feeling, common sense and emotions are of no help to Sven here, as long as he is rationally maximizing utility Homo economicus want to act.
By the way, based on the information presented here about Sven and Charlotte, it is by no means clear that Charlotte invested better on balance. If Sven had made his stock investment in question (MSCI ACWI IMI Index) before October 2016 (i.e. about three and a quarter years ago), then as of March 23, 2020, despite his described loss (drawdowns) since February 20, he would still be in just as good or even better shape than Charlotte, who naturally achieved a nominal zero return (in real terms a negative return) on her bank balance in recent years.
(7) How risk management really works
Whenever there are severe downturns in the stock market, an old, essential insight from financial economics completely disappears from the field of vision of private investors, which unfortunately is hardly taken into account by many even during “normal” times: risk management in capital market investments does not happen via “in-out” along a simple path Crash-on-crash-off spectrum, but rather through the long-term determination of a “level 1 asset allocation” that is appropriate for the specific household. It is the division of the portfolio into one risky part of the portfolio that is responsible for generating returns for the entire portfolio, and one low risk Portfolio part that ensures the stability (security) of the overall portfolio.
This simple dichotomy must be individually balanced in such a way that even a 50% crash in the stock market is unlikely to force the household in question to sell, either mentally-emotionally or for liquidity reasons. A 20/80 (risky/low-risk) ETF portfolio constructed using this actually simple scientific principle would currently only be down about 7% overall. 80% of the portfolio would show no losses at all. In return for this comparatively high level of security, the portfolio owner of course also has to accept a lower long-term return: “No pain, no gain,” as the Anglo-Saxons say. In one sentence: By adding a “risk-free” investment (bonds with a high credit rating, a short remaining term and no exchange rate risk) you can maximum drawdown which will most likely not be exceeded in a stock crash, can be mitigated almost at will.
Another fundamental principle in portfolio structuring and risk management is consideration all Assets of the household namely always and at everyone Investment decision, including sales. Table 3 contains an illustrative example of a private household consisting of two adults aged 40, both of whom are employed with the intention of working until 67 and with slightly above-average assets and income.
Table 3: Example of a private household's balance sheet
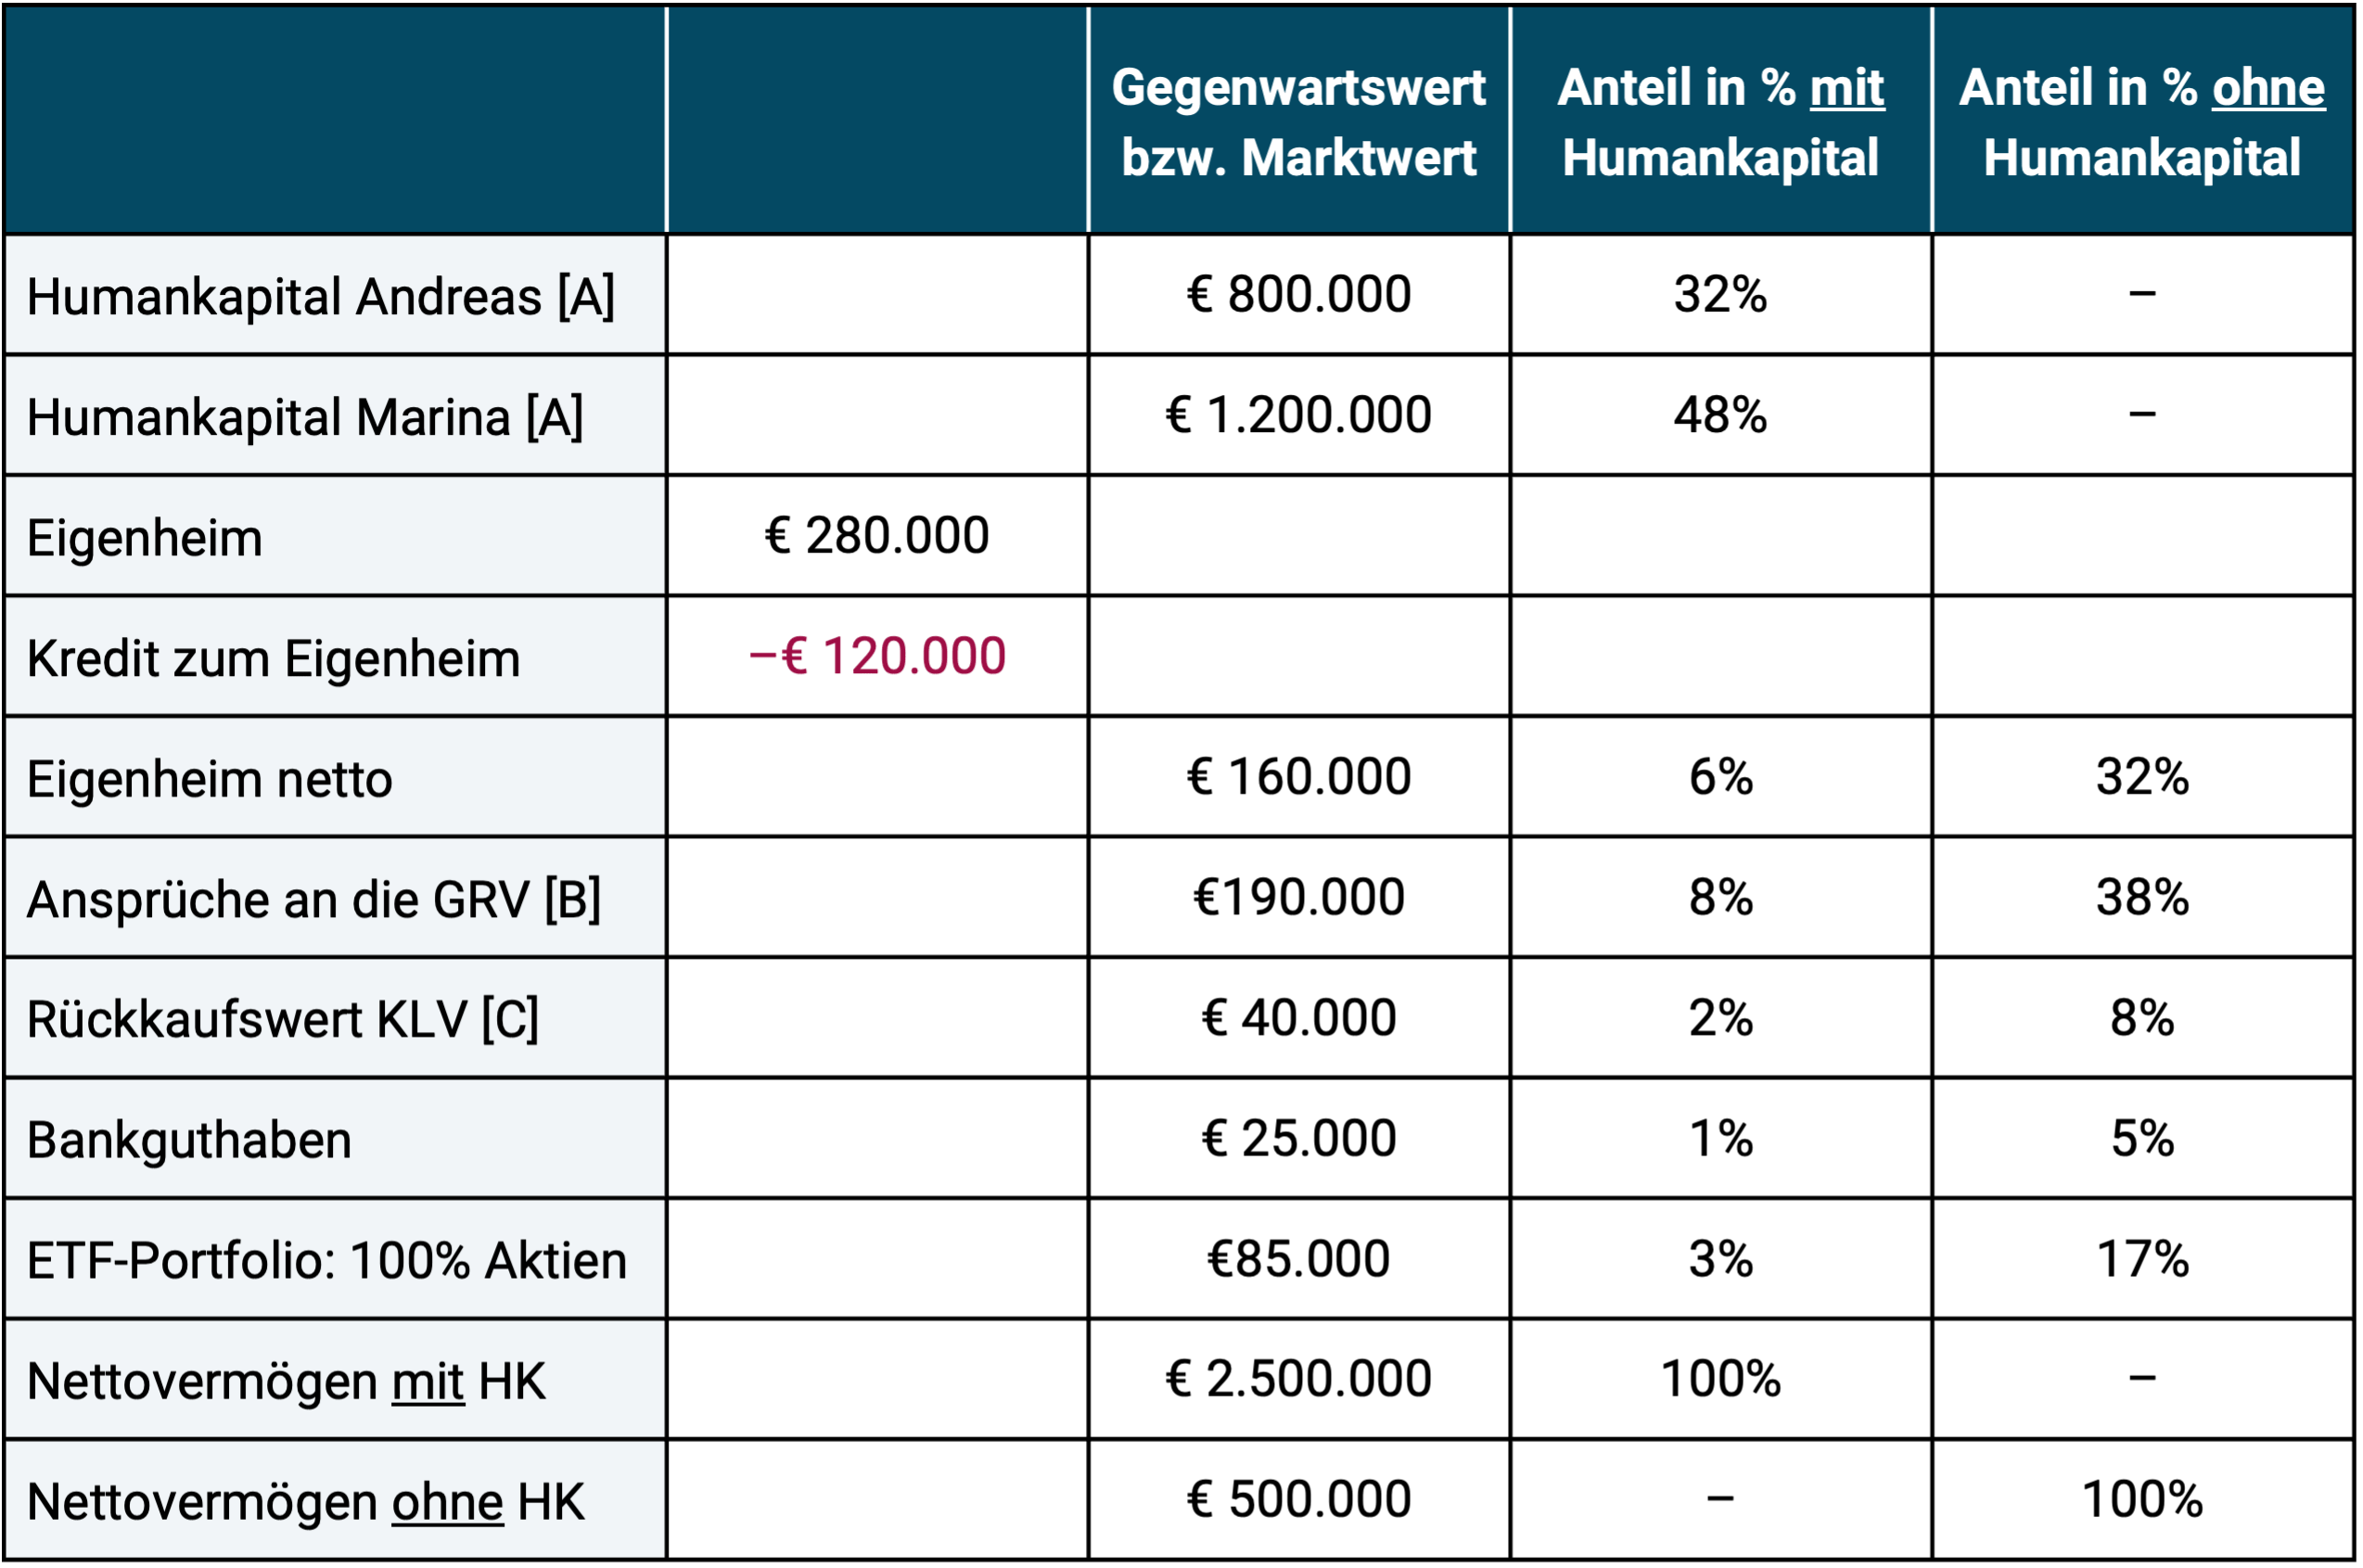
► Percentages rounded commercially (hence addition not necessarily to exactly 100%). ► [A] Human capital is the present value (present value) of the net income an employee has not yet received until the planned termination of employment. ► [B] GRV = statutory pension insurance. The number shown corresponds to the present value of the expected pension when average life expectancy is reached. ► [C] KLV = capital-forming life insurance.
The bottom line from Table 3: If we assume that Andreas and Marina have just suffered a 50% book loss on their ETF stock portfolio in a 50% stock crash, then their total assets have still only shrunk by about 1.5% if one takes into account the two largest assets in the household - human capital - and only about 8.5% if one excludes human capital. Even if one additionally and realistically assumes that home ownership and human capital will suffer a loss of value as a result of the Corona crash, that does not change the fundamental insight; Since stocks only make up a small or relatively small part of the total assets of the vast majority of households in Germany, the negative crash effect on the Total assets less significant than an isolated, somewhat misleading look at the bank deposit alone suggests.
Finally, we would like to make a comment that is not directly related to “crash processing knowledge”, but rather relates to a general economic aspect of the Corona crisis. Since the beginning of the Corona crash, some of the “prophets of doom” with which Germany is particularly richly blessed – Mark Friedrich/Matthias Weik and Markus Krall – have been roaming the country with the outrageous thesis that the collapse on the stock markets was “only triggered” by the Corona pandemic, but was not actually caused by it. The actual causes would have existed beforehand (“zero interest rates”, “excessive debt”, “zombie companies”, etc.). No solid evidence for this “theory” is provided beyond the empty phrases, catchphrases, selectively selected data and “stories” that have been repeated in their books and lectures for years, at least nothing that university economists would take seriously. [7]
Ultimately, it will never be possible to say with exact certainty which one, not even a few years after the crisis ends specific factor triggered a stock market crash, but no serious academic economist doubts that Corona is the main factor in this case. If you consider the gigantic real economic damage that Corona is causing or is potentially causing worldwide right now before all of our eyes, it seems hair-raising not to see the main cause here. It should be made clear that the global stock market in particular was close to its “fair” (normal) valuation level at the beginning of 2020, i.e. by no means in one bubble and the debt ratio of western industrialized countries has not increased from 2009 to the end of 2019 (total debt from the state, companies and private households relative to gross domestic product). [8]
Conclusion
Let's recap the main points of this blog post:
- Stocks were, are and will remain the most profitable asset class.
- Market timing is likely to hurt – even in a crash.
- What we can learn from history is that this recent crash is probably not unique in its key aspects that are relevant to investors. The prices of a globally diversified stock portfolio will eventually return to and then exceed the pre-crash level of February 20, 2020. Those who have not sold before will primarily benefit from this.
- Real estate and non-listed company investments are also not immune to Corona.
- “Out of stocks and into bank deposits” creates a new, different type of risk (bank failure risk) if the sales proceeds exceed the state deposit insurance and remain in the bank account for more than a few weeks.
- Stocks are now “cheap.” The forward-looking expected return of the equity asset class is now higher than it was around a month ago.
- Risk management is not about “out and in” – neither in a crash nor in normal times – but rather via an asset allocation from the portfolio components that suits the investor’s budget risky versus low risk.
Endnotes
[1] Asset classes (German asset classes, forms of assets) are logically sensible groupings of assets such as: B. Stocks, bonds, money market investments (cash-like investments), real estate, precious metals, raw materials and collectibles. These main asset classes can be subdivided into sub-asset classes in a variety of ways. The specific division of a diversified portfolio into asset classes (“asset allocation”) has a very high influence on its return-risk characteristics.
[2] This 4.4% p.a. only represents the inflation-adjusted “price return” (appreciation return). To this end, an estimated net rental yield (gross rental yield less maintenance and insurance) of around 2.5 to 3.0 percentage points per year must be added and at the same time around 12 percentage points of one-off purchase and sale costs (including property transfer tax) must be subtracted (i.e. around one percent per year). Reliable, precise net rental yield data is generally not available for the residential real estate market. The credit leverage effect from external financing was not taken into account here.
[3] An information-efficient market is one in which all publicly available information about a security is reflected (priced in) very quickly, one could also say “rapidly quickly”, in the prices of the securities.
[4] A stop-loss order triggers an automatic sell order as soon as the price falls below a downward price mark.
[5] “‘Don’t grab a falling knife’ is the stupidest of all stock market sayings,” says the successful real estate investor and multiple millionaire Dr. Rainer Zitelmann: https://www.youtube.com/watch?v=eWRXOks2bmw&feature=youtu.be
[6] Here is the definition from Wikipedia: “Sunk costs; often also referred to as irreversible costs or casually as EDA or Eh-da costs) costs that have already been incurred and cannot be reversed (e.g. through sale).”
[7] Here is an example of a short media article by a scientist on the “stories” of the doom prophets Friedrich and Weik: https://www.spiegel.de/wirtschaft/finanzkritik-was-an-den-argumenten-der-crash-propheten-dran-ist-a-1302526.html
[8] World Bank Group (2020): “Waves of Debt – Causes and Consequences”; Advance Edition; Internet reference: https://www.worldbank.org/en/research/publication/waves-of-debt
literature
Goetzmann, William / Kim, Dasol (2018): “Negative bubbles: What happens after a crash?” In: European Financial Management; 2018; 24; No. 2; pages 171-191
Jacobs, Heiko / Weber, Martin (2016): “Random Walk plus Drift – What share prices really are”; (2016); University of Mannheim; Behavioral Finance Volume 28
Kommer, Gerd / Schweizer, Jonas (2018): “The return on investments in real estate”, October 2018; https://www.gerd-kommer-invest.de/die-vergleich-von-direktinvestments-in-wohnimmobilien-besser-verstanden/
Watts, Duncan (2011): “Everything Is Obvious: Once You Know the Answer”; Crown Business; 2011; 352 pages