
From Gerd Kommer and Alexander Weis
Rational investing is characterized by sobriety, scientific orientation and the principle of comparing investment considerations with historical data that goes back far into the past; So not just with data from the last twelve months or five years, as is common in the financial industry. More recently, the term “evidence-based investing” has become popular for this approach. Around 95% of everything that the established financial industry and financial sites on the Internet promote is in one way or another contradictory to evidence-based investing.
A practical implication of evidence-based investing is to consistently steer clear of all investment approaches and ideas that do not have such long-term data as to whether they work - data that must come from independent scientists, not from the financial industry.
Fortunately, there has been much progress in economics in recent years in obtaining and disseminating long-distance, high-quality historical data. “High quality” here means that the data is cross-national (ideally global) and has a minimum quality in the sense of representativeness. The better these criteria are met, the more relevant the data is for the future. Only on the basis of such data series can given investment strategies be truly validated.
Against this background, the recently published publication of a study on the historical returns of emerging market hard currency government bonds by a German-American research team consisting of Josefin Meyer, Carmen Reinhart and Christoph Trebesch (hereinafter “MRT”) was a giant leap forward (link). (“Hard currencies” are the leading currencies in industrialized countries - especially USD, EUR, JPY, GBP and CHF - which dominate as transaction currencies in international goods and services). From the perspective of an evidence-based investor, one is almost inclined to attribute the attribute groundbreaking to the 80-page essay entitled “Sovereign Bonds since Waterloo” (hereinafter, for the sake of brevity, “MRT study”).
The three authors and their student assistants meticulously calculated and documented the inflation-adjusted returns and risk of emerging market government bonds over the 200 years from 1815 to 2016. [1] These returns are astonishingly high and probably higher than what was commonly believed before the MRT study was published [2]; At the same time, the risk is rather smaller than expected. Before we get to the interesting figures, it is important to note that such a comprehensive, representative study on emerging market government bonds has not existed to date.
When assessing the MRT numbers, it should be taken into account that they are not fair-weather data, as is often used by the financial industry. On the contrary: the 200 years of returns history in question include the effects of two world wars, countless regional wars and civil wars in the 19th and 20th centuries, the decades-long, often bloody phase of decolonization in developing countries after the Second World War, dozens of emerging market currency crises and sovereign bankruptcies and several global economic crises (e.g. the Great Depression of 1929 to 1937 and the Great Financial crisis from 2007/08). Of the 91 countries in the data set, only ten have no default at all over these 200 years, i.e. no debt crisis. It can certainly be said that a tougher “stress test” is hardly conceivable. That's one of the reasons why this data is so powerful.
The fact that it was possible to achieve a risk-adequate return on a globally diversified and long-term basis, even and especially with bonds from countries with very weak credit ratings, is likely to be a new insight for those investors who did not yet know or understand the somewhat unique properties of government bonds. (We explained in our blog post entitled: For structural reasons, states almost always have to have a better credit rating than the companies in these states The principle of “Sovereign Ceiling” shown.)
Table 1 compares MRT emerging market government bond returns for the period 1816 to 2016 (201 years) with those of other asset classes. The yield comparison suggests that emerging market hard currency (HC) government bonds can be an attractive asset class.
Table 1: Inflation-adjusted return and risk of emerging hard currency sovereign bonds compared to other asset classes from 1816 to 2016 - before costs and taxes (201 years)
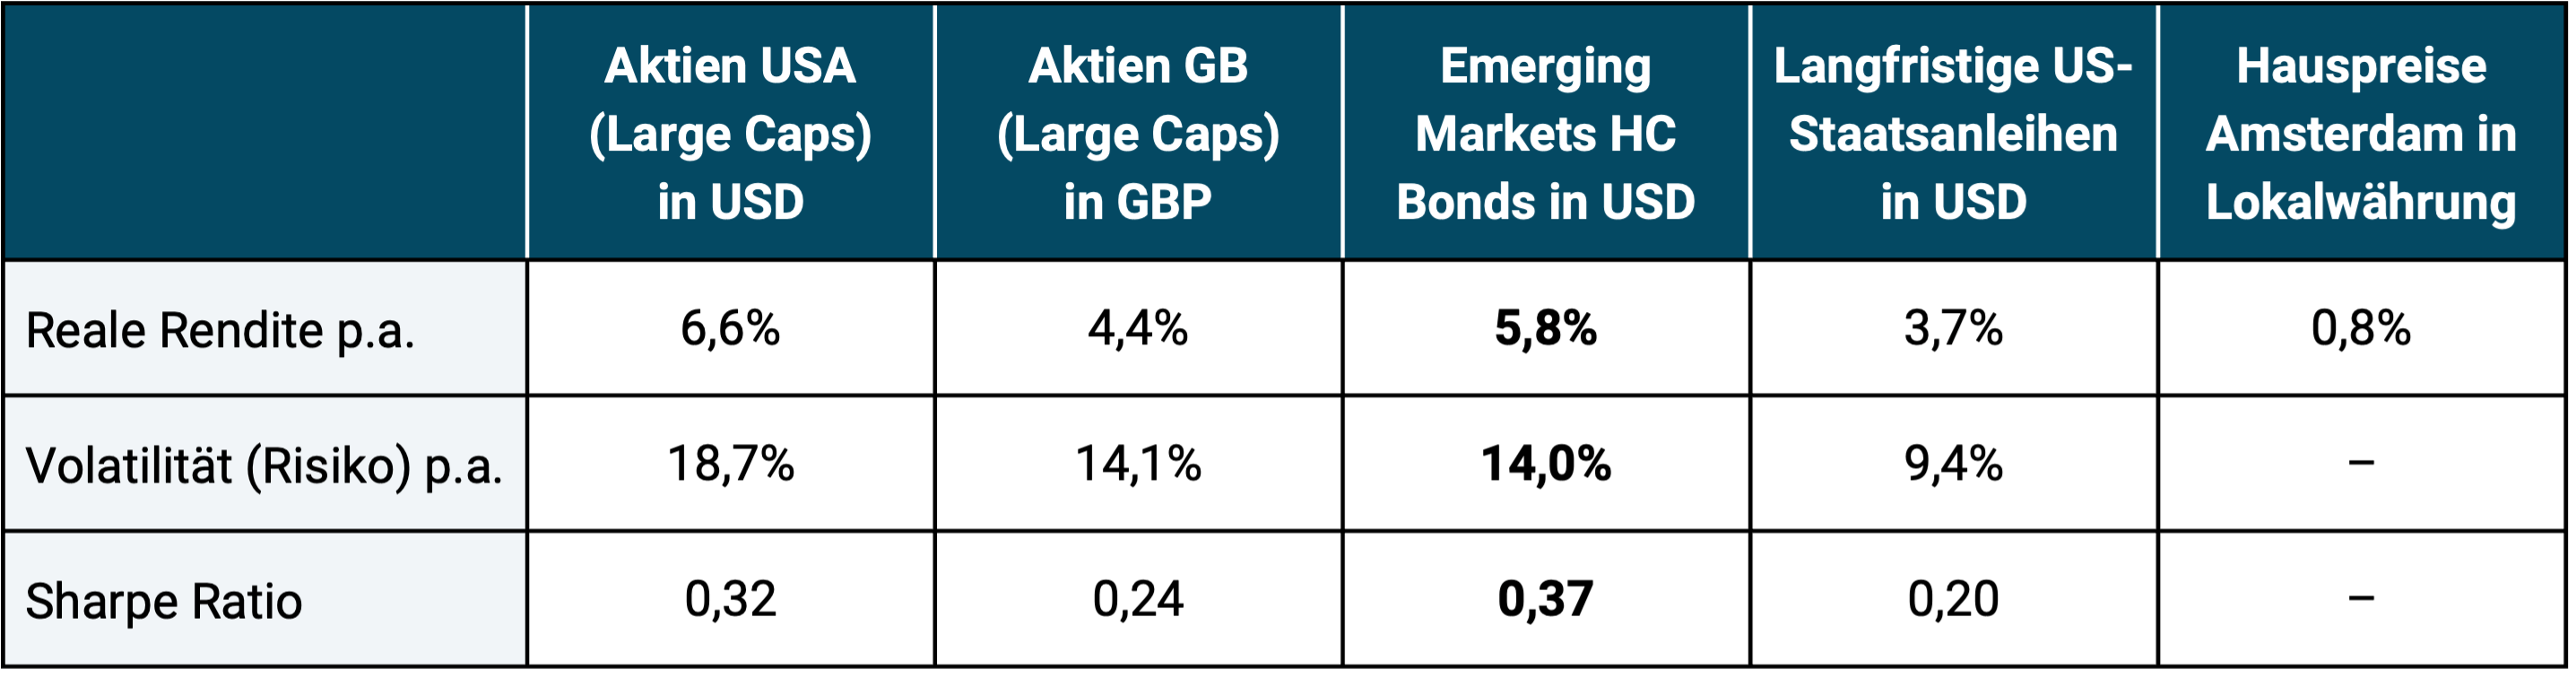
► Geometric annual average returns before costs and taxes. ► Volatility = standard deviation of real annual returns. ► Sharpe Ratio: Arithmetic “excess return” per unit of risk (risk-adjusted return). ► Data sources: Meyer/Reinhart/Trebesch 2019; House prices: Piet Eichholz until 1973, then BIS (Basel). ► House prices: Herengracht index (Amsterdam) until 1973, then residential properties throughout the Netherlands (excluding net rental yield). Volatility and Sharpe ratio for the real estate index could be calculated, but for structural reasons it would be falsifying in comparison with capital market investments (Kommer/Weis 2018). We are otherwise unaware of house price indices of acceptable quality going back to 1816. ► Table 2 below shows data for the 25 years from 1994 to 2018. For reasons of space, we do not list returns in additional subperiods in Table 1 and refer interested readers to the original MRT article.
Below we briefly summarize the other key results of the MRT study and explain at the end of this blog post what insights this can provide for investment practice:
- MRT calls the 1,400 government bonds examined “external bonds”. Outside the guild of economic historians, one would rather call it “emerging market government bonds in hard currency”.
- The data set includes 91 countries that issued bonds in the currencies British pound (mainly the first 100 years) and US dollars (mainly the second 100 years) over these 200 years, i.e. not bonds in local currency, but - from the perspective of the issuing states - bonds in foreign or hard currency. These are currencies that the issuing state did not control itself. The two countries Great Britain and the USA are naturally not included in the data set because they control the relevant currencies (in the first hundred years the USA would otherwise have been classified as an emerging country). Until the First or Second World War, a number of countries that are now rich industrialized countries (e.g. Switzerland or Norway) belonged to the group of emerging countries and are included in the data set with their hard currency bonds at the time.
- The most important, although not only, reason why the MRT study resulted in higher average returns than previous studies is that MRT takes into account the so-called recovery value of those government bonds that eventually defaulted. This is a weighted average of 62%. In an average bankruptcy case, a buy-and-hold investor only suffered a 38% loss (“haircut” in economist jargon). Most researchers in previous studies, however, assumed a 100% loss for these numerous default cases because they did not have recovery value data or were afraid to find it.
- It was already known beforehand, but the MRT study once again underlines that hard currency emerging market government bonds (hereinafter abbreviated as EM HC bonds) are an independent and clearly definable asset class. For the past 25 years (1994 to 2018) we have calculated the correlation between EM HC bonds and industrial country stocks (MSCI World IMI index). It is only +0.47; that for German government bonds (RexP) only +0.08 (all underlying yield data in euros). Correlations below +0.75 are generally worth considering from a risk reduction perspective. It is also interesting that even the correlation between EM HC bonds and EM stocks (MSCI-EM-IMI index) was only +0.64 over this period.
- MRT also calculate risk-adjusted returns for EM HC bonds in the form of the so-called Sharpe Ratio (a ratio that relates return to risk and expresses return or “excess return” per unit of risk). Here too, EM bonds perform well. Your considerable returns are therefore not at the expense of a disproportionately high level of risk.
- There is a logical and exploitable positive relationship between the level of default risk (bankruptcy risk) and the return on bonds. In other words, those countries with higher risk (e.g. measured by default frequency) had higher returns overall than countries with lower risk - i.e. what one would expect in a functioning market. All in all, this even applies to the returns of notorious “serial default countries” such as Argentina, Ecuador, Mexico, Venezuela, Greece, Ukraine and several others.
- The MRT data set does not contain data for the period from 1974 to 1993 (20 years), as only a small, perhaps unrepresentative number of EM HC bonds were issued during this period. During these two decades, emerging countries financed themselves primarily through loans from major international banks, the so-called Syndicated Loan Market. Its return data is less easy to find and, for several reasons, only comparable to bond data to a limited extent. [3] They are therefore missing from the 200-year period. MRT speculates that taking this data into account would marginally reduce the average return for the entire period.
- It is clear from the MRT paper that although EM HC bond returns fluctuate (like the returns of all risky asset classes), the fluctuations are not period-specific: the particularly attractive or particularly unattractive years are not systematically concentrated in a particular period.
- On emerging markets bonds in local In currency (soft currency), the MRI findings and data results cannot necessarily be transferred. For this very different asset class, there is hardly any reliable data that goes back more than a few years.
Table 2 shows the returns for the more recent sub-period from 1994 to 2018. In these two and a half decades, EM HC bonds returned slightly above the average for the entire 200-year period. This certainly also has to do with the (unrepeatable) “return tailwind” that the entire global medium- and long-term bond market experienced from the mid-1980s to approximately 2016 due to the pronounced interest rate reduction trend during most of this period. On the other hand, severe emerging market crises occurred in the second half of the 1990s and the beginning of the 2000s, with numerous defaults for many countries (Latin America, Southeast Asia, Russia) that are included in these data.
Table 2: Inflation-adjusted return and risk of emerging hard currency sovereign bonds compared to other asset classes from 1994 to 2018 - before costs and taxes (25 years)
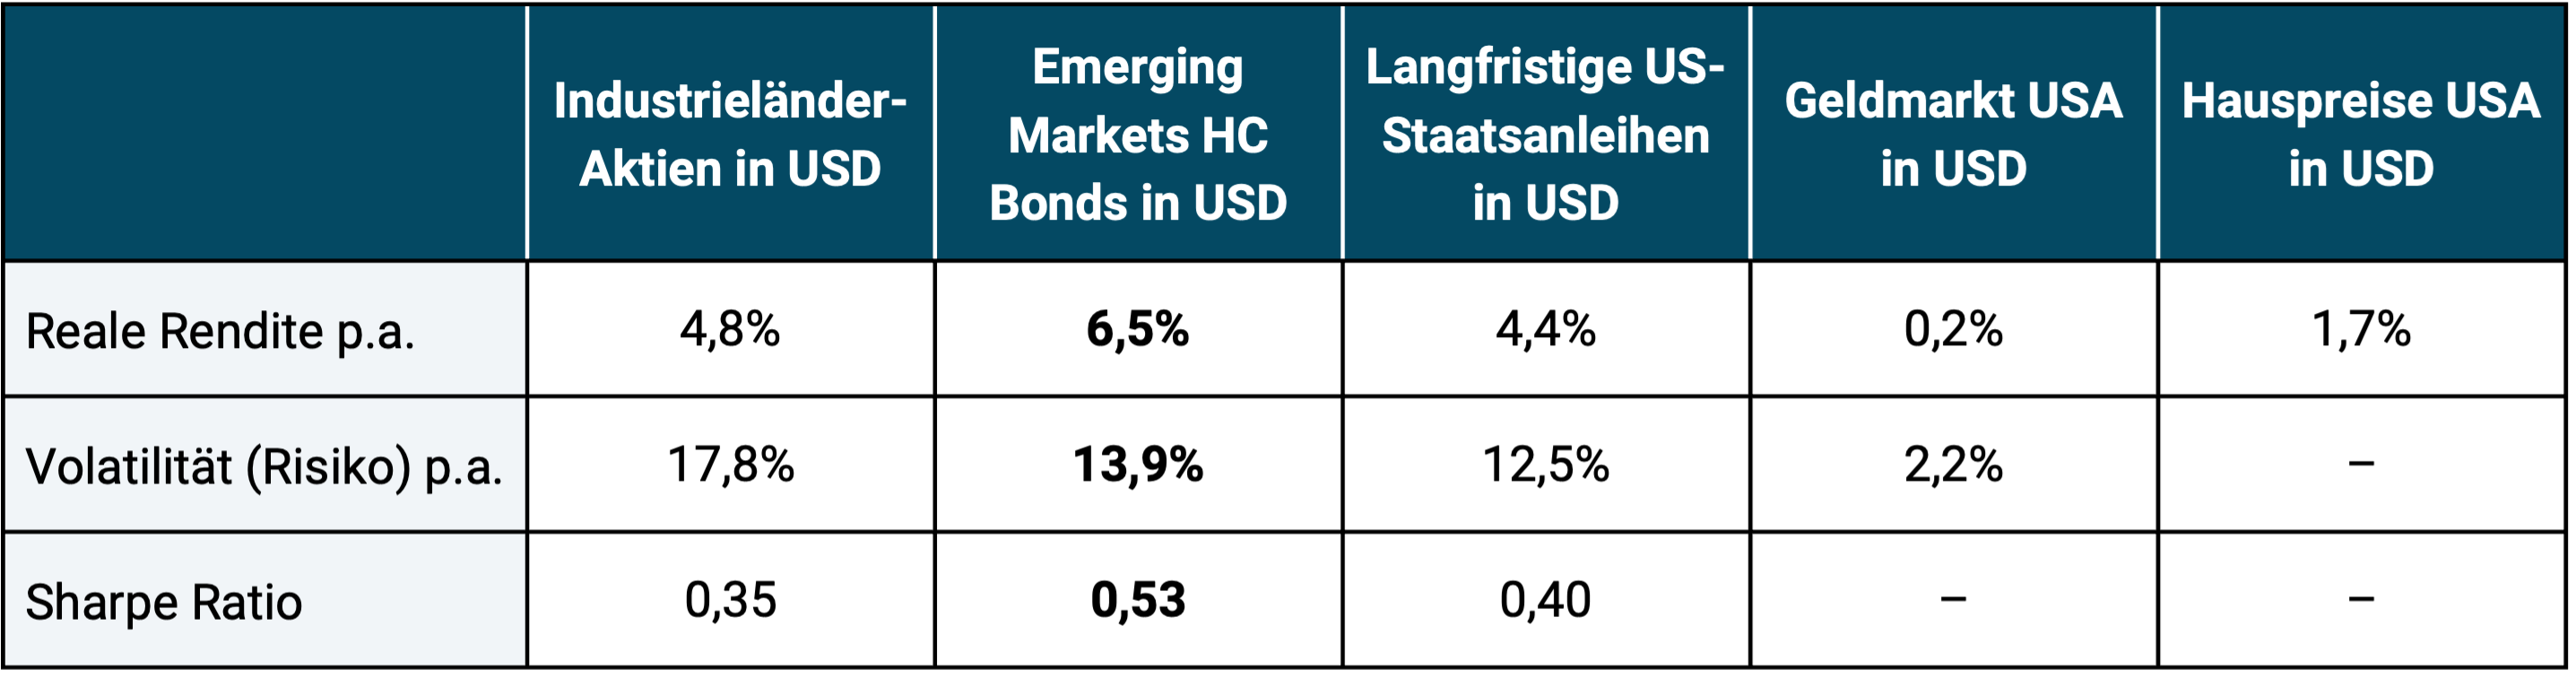
► Geometric annual average returns before costs and taxes. ► Volatility: See explanations for Table 1. ► Sharpe Ratio: See explanations for Table 1. ► Data sources: MSCI, DFA, Bank of Canada, Bloomberg, Yahoo, S&P. ► Developed market stocks: MSCI World Standard; Emerging Markets Government Bonds: JP Morgen EMBI+ Index; Long-term US government bonds in USD: 20 year bonds; USA money market: One-Month Treasury Bills; House Prices USA S&P/Case-Shiller U.S. National Home Price Index (excluding net rental yield), for house prices see further explanations on Table 1.
Let's move on to the practical investment conclusions that we owe to the research work of Meyer, Reinhart and Trebesch:
- In our view, the new MRT study has, for the first time, provided the most comprehensive empirical confirmation of the attractiveness of the asset class of emerging market government bonds in hard currency.
- The risk of individual government bankruptcies, just like the bankruptcy risks of individual companies, can be diversified away in the equity asset class. To diversify in this way, however, you must pursue a systematic global and long-term investment approach.
- If you want to incorporate the EM HC Bonds asset class into your portfolio, you should assign it to the risky part of the portfolio. They are not a replacement for the low-risk (“risk-free”) portion of the portfolio, which is known to consist of short-term bonds with high and highest credit ratings and has no exchange rate risk - EM HC bonds typically only meet one or none of these three criteria. (For the avoidance of doubt: bank deposits outside of state deposit insurance are also not low-risk investments.)
- Bad reasons to buy EM HC bonds include their high distribution yield or the much lower debt ratios of emerging markets compared to developed market countries. High distribution yields generally represent a meaningless or misleading investment criterion. Low national debt alone does not protect against bond default, as the MRT data shows.
- There are currently around a dozen products available on the German ETF market that track EM HC bonds at low costs and without manager risk.
Endnotes
[1] It can be said that the modern market and world economy as we know it today emerged around this time. At the end of the 18th century, on the one hand, the industrial revolution began and, on the other hand, the decline of religiously legitimized feudalism (monarchism) in Western countries.
[2] Asset classes are logically meaningfully defined categories of asset classes (asset = asset) such as: B. Stocks, bonds, money market investments, real estate, raw materials or collector's items. These main asset classes can be subdivided into sub-asset classes in a variety of ways.
[3] Syndicated loans contain many individual case-specific and interest rate-influencing “conditional rights” (“covenants”) of the debtor and e.g. T. also of the creditor, which is missing from bonds; In addition, every bank has different refinancing costs.
literature
Dehn, Jan (2019): “The Case for EM External Debt”; (Ashmore Group); June 4, 2019; Internet reference: https://www.advisorperspectives.com/commentaries/2019/06/04/the-case-for-em-external-debt?
Kommer, Gerd / Schweizer, Jonas (2018): “The risk of investing in real estate”; Internet reference: https://gerd-kommer.de/blog/das-risk-von-investments-in-immobilien/
Meyer, Josefin; Reinhart, Carmen; Trebesch, Christoph (2019): “Sovereign Bonds since Waterloo”; No. w25543; National Bureau of Economic Research; January 2019; Internet reference: https://www.nber.org/system/files/working_papers/w25543/w25543.pdf