
From Alexander Weis and Gerd Kommer
This blog post was updated in November 2024.
Private equity investments are considered exclusive and particularly profitable. Historically, private equity (“PE”) was marketed by its providers only to institutional investors and very wealthy private investors, as a PE investor must meet the regulatory requirements of a “professional” or “semi-professional” investor. This meant that private investors had to meet a regulatory minimum asset as well as minimum standards regarding knowledge and investment experience.
Due to regulatory easing and the “creativity” of the PE industry, these entry hurdles have fallen noticeably in recent years, so that investing in PE is possible for “normal private investors” with some providers at starting amounts of 10,000 euros. [1]
In this blog post we will show what exactly PE is and how PE compares to other forms of investment in terms of return, risk and liquidity.
What is Private Equity?
Private equity involves equity investments in unlisted companies. PE is therefore the counterpart to shares, i.e. “public equity”, i.e. listed equity (equity). Both are investments in companies.
The PE universe consists of three main categories: Buyouts (more precisely: Leveraged buyouts – LBOs), Growth Equity and Venture capital.
The transaction vehicle of a PE investment, the “outer shell” or “packaging”, is usually a private equity fund that is launched by a PE firm and then managed for a fee. Private investors and institutional investors can participate in the fund as “limited partners”.
The PE fund manager, the “initiator” or “general partner” (general partner), usually also invests in the fund with his own money. This is intended to ensure that its economic interests run parallel to those of the fund investors. (It is doubtful whether this goal is always achieved in practice. However, for reasons of space, we will not go into this aspect in more detail here.)
The three private equity variants
Buyout funds acquire investments in established, fairly large companies with sales that typically exceed 500 million to one billion euros and a rather low valuation due to low profitability and outdated or at least improvable business models. [2] As a rule, the purchase of a company by the PE fund is followed by operational interventions and even comprehensive restructuring. In the buyout segment, a lot of debt capital is used, i.e. debt financing or credit leverage, hence the term “leveraged” buyout. [3]
With Growth Equity (GE) – sometimes referred to as “buy and build” – the fund acquires equity investments in established small to medium-sized companies, usually with a purchase value of less than 50 million euros and with good profitability and solid growth potential. In some cases, these companies are then merged to achieve a higher valuation (i.e. valuation gains) as a larger entity. Here too, the investors' equity is leveraged with outside capital (debt), but to a lesser extent than with buyouts.
In the case of venture capital (VC), the fund invests in comparatively tiny, mostly still loss-making startups with high growth potential and high valuation. In contrast to LBOs and GE, debt capital is usually not used, or if so only for a short time.
Measured by the market value of the annual transaction volume, LBOs form the largest segment among the three PE types, followed by VC and then GE.
A standard investment in a PE fund has a term of six to 15 years. Buyout funds tend to be closer to the end of this range, growth equity funds in the middle, venture capital funds closer to the beginning. Before the end of the contractual or scheduled term, the investor can usually only sell the fund shares if he accepts financial disadvantages. PE investments are therefore illiquid – even more illiquid than direct investments in individual properties.
At the end of the scheduled term, the manager of the PE fund sells the investments contained in the fund. The fund will be liquidated - either through an IPO, through sale to another PE fund or through sale to normal industrial companies. The sales proceeds are then distributed to the fund shareholders (the investors).
If the project develops significantly below plan, it may take longer until it is sold or investors may have to inject additional money on a voluntary basis in the hope that this will lead to an improvement in returns.
PE is often referred to as a separate asset class for marketing reasons by the industry or due to ignorance by journalists. In reality, PE is just a packaged Financial product, just as a capital-forming life insurance policy, a certificate or a normal actively managed stock fund (mutual fund) are packaged financial products. In the packaging, PE contains the actual asset class “entrepreneurial equity” – no different than an actively managed equity fund and/or a passively managed equity ETF.
The financial product “closed funds”, which has been truly disastrous in terms of returns over the last 20 years, is a form of “private equity for the little man” that is widespread in Germany.
The following Table 1 compares the most important distinguishing features of private equity and stocks.
Table 1: The main differences between a private equity investment and a stock investment
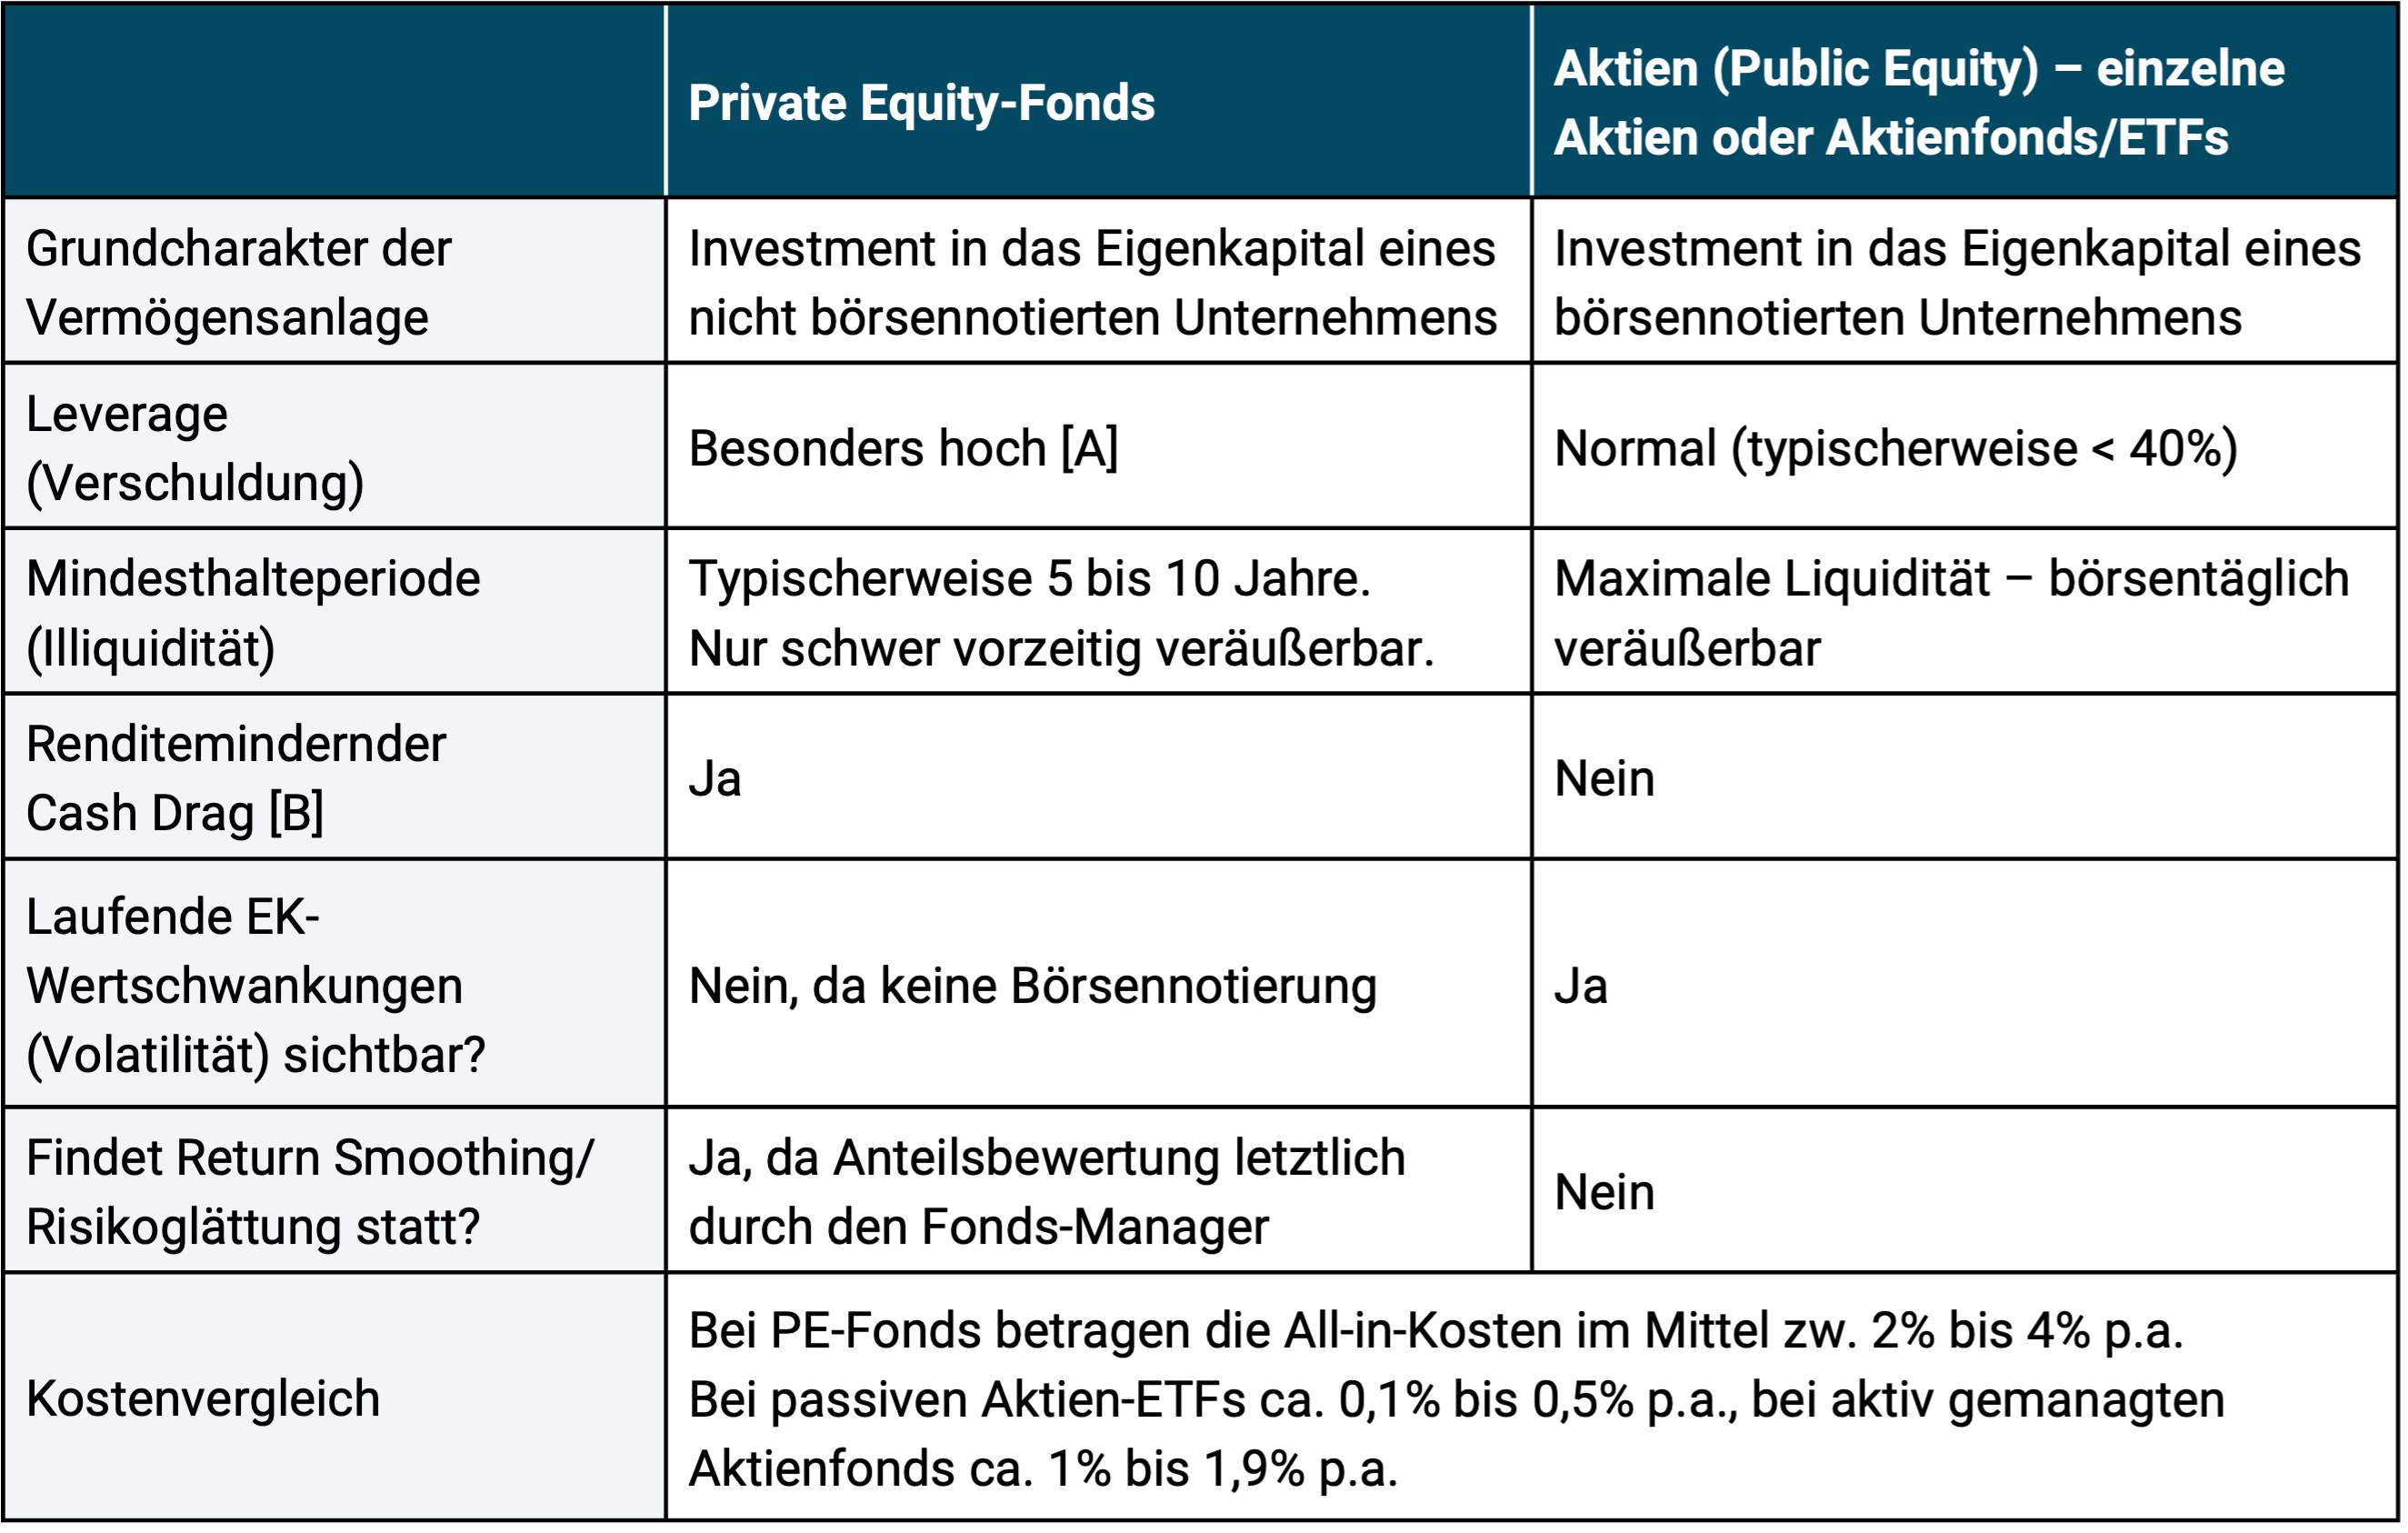
► [A] Only applies to PE investments in the buyout sector/LBO sector (approx. 60% of the global PE volume), applies less to growth equity and almost not at all to venture capital. The aggregated debt at company level, fund level and, if applicable, private investor level is considered. ► [B] Cash Drag: With PE investments, the private investor typically has to have low-interest liquidity available for several years in order to service the successive cash calls, which cannot be reliably predicted either in terms of timing or amount. The significant opportunity costs of this mechanism are almost never taken into account in the published returns of PE investments. More about cash drag here.
Scholars have always argued about the sustainable returns and risk of PE compared to public equity (stocks), as the data situation and the return calculation for PE are “not easy” in several respects. We explore this crucial question in this blog post.
Logically, assuming sufficiently large samples and sufficiently long analysis periods, there should not be a major difference in return and risk between PE and public equity (stocks) (at least without taking the different fee levels into account). As stated above, both PE and the stock market are equally equity investments in companies. The fact that the underlying companies are listed on the stock exchange in one case (stocks) and not in the other (PE) is a predominantly purely external difference.
Return and risk of PE investments
In fact, the sustainable returns and risk of PE are rather unclear and the “eternal dispute” over the relative returns of private and public equity can be summarized something like this:
Due to the nature of the PE industry and individual PE investments, truly meaningful, reliable PE return data is difficult to collect and often not as easy to interpret as normal security returns. See the causes below.
From science - this means financial economists who are employed at universities and not If you work at a PE company (not even part-time) - the majority of people say that PE returns if you all taking into account technically relevant factors and fees, are not higher in the long term and perhaps even slightly lower than those of public equity, the corresponding stock market segments.
Unsurprisingly, one hears opposition from the PE industry (including the PE database operators), which is obviously subject to conflicts of interest when it comes to PE returns. This is often supported by data whose quality and significance are subject to considerable question marks.
How to explain the private equity data problem?
First, because PE funds are “private” (i.e. not listed) investments, they are not required by regulatory law to report their returns to anyone outside of their circle of investors. This promotes a well-known data problem in the investment sector: “survivorship bias”. For poorly performing PE funds, the return data is disproportionately often not (or no longer) reported to the data collection agencies, so that the remaining “overall market data” looks too positive.
Second, most PE industry data series date back less than 20 to 25 years. That's generally borderline short, but in this case it's particularly unfortunate because for most of this period, loan interest rates (at least until the end of 2021) were low - by historical standards and also had a downward trend. Since a particularly large amount of debt capital (credit leverage) is used in the PE sector as a whole, PE returns during this time experienced a tailwind that was not representative of the future, which had less of an impact on public equity due to the lower level of debt there.
Third, the returns published by the PE industry (and also by individual PE funds) ignore the “cash drag problem,” also known as the “cash call problem.” We deal with this “financial-mathematical deception” of the PE industry, which is probably not completely overlooked by most private investors due to its serious implications, in a separate blog post (here). The cash drag problem means that the return on the average PE investment of a private investor is probably overstated by one to two percentage points per annum.
Fourthly, PE funds calculate the values of the fund shares themselves at the end of the quarter, since there are no real market prices for them due to the lack of a stock exchange listing. The fact that the actual fluctuation in share prices only becomes visible over time, i.e. “optical risk reduction”, is undisputed in the industry itself and in science (Chandra et al. 2019, Jackson et al. 2023, Callanan et al. 2024, Couts et al. 2024). Warren Buffett once commented on this particular aspect in an exaggerated way: “Private equity firms are typically dishonest” – see here.
The head of the US fund company AQR Capital Management, Cliff Asness, calls the smoothed return data of the PE industry “Volatility Laundering” in a sarcastic reference to the subject Money laundering (Money Laundering) (Asness 2023). Since volatility smoothing/laundering is systematically practiced in the PE sector, practically nothing can be derived from the officially reported fluctuations in value and returns of an individual PE fund or conventional PE indices about the actual risk of the investment.
If you want to sell an individual PE investment prematurely, the low volatility fake effect is often reflected in the sales price deviating significantly from the share price recently reported by the fund manager - the proverbial "bad surprise". (But the rarer upward deviations in the case of early selling are also a sign of the glossed-over volatility.) Occasionally, such a nasty surprise doesn't even require an early sale. In the case of individual, poorly performing funds, it also happens out of the blue when the business of the companies they contain has been so negative for a long time that the refusal not to reduce the fund's share values simply can no longer be maintained.
An important additional aspect of the underreported volatility is that this “fake volatility” results in a visually attractively low correlation between PE and the stock and bond markets. This exaggerates the diversification benefits of PE in a mixed portfolio (Stubben/Welch 2018). In the marketing presentation we received from a PE provider, a correlation between a PE index and the MSCI World of “< 0.1” of “< 0.1” was claimed for the period from 2007 to 2023, which was mathematically correct but still completely implausibly low.
All in all, we believe there is a significant reliability problem in the return data published by the typical PE fund and the PE industry.
A simple and obvious way to get closer to long-term PE returns and their true risk is the approach we practice in the table below.
How could one solve the PE return data problem?
We compare the return and risk of the global PE sector with a corresponding equity benchmark. The PE sector is dominated by the LPX50 index pictured. It represents the stock returns of the 50 largest publicly traded PE fund companies in the world, including the four largest and best-known PE houses globally: Blackstone, Carlyle, KKR and Apollo (all USA). [4] These companies each operate hundreds of PE funds that invest in unlisted companies and are mostly segmented by industry and region.
The income of a company like Blackstone consists, on the one hand, of the returns on its equity in its own PE funds and, on the other hand, of the management fees it earns for its role as a PE fund manager. The amount and fluctuation of these fees depend on the investment success of the PE fund investments.
In addition to its simplicity, our return comparison method has the considerable advantage that the biases and suspected errors or gaps in the PE fund return databases that have been documented “thousands of times” in the specialist literature are completely eliminated here as a method.
Because the majority of investments are in the LPX50 index [5] in companies based in the USA and because buyouts are the focus of this index, we have chosen the MSCI USA Small Cap Index as the public equity benchmark in Table 2. (However, choosing the MSCI World Small Cap Index would only slightly change the overall result in the right column.)
Table 2: Historical returns of private equity investments compared to stock market returns from 1994 to 2023 (30 years) – nominal in euros
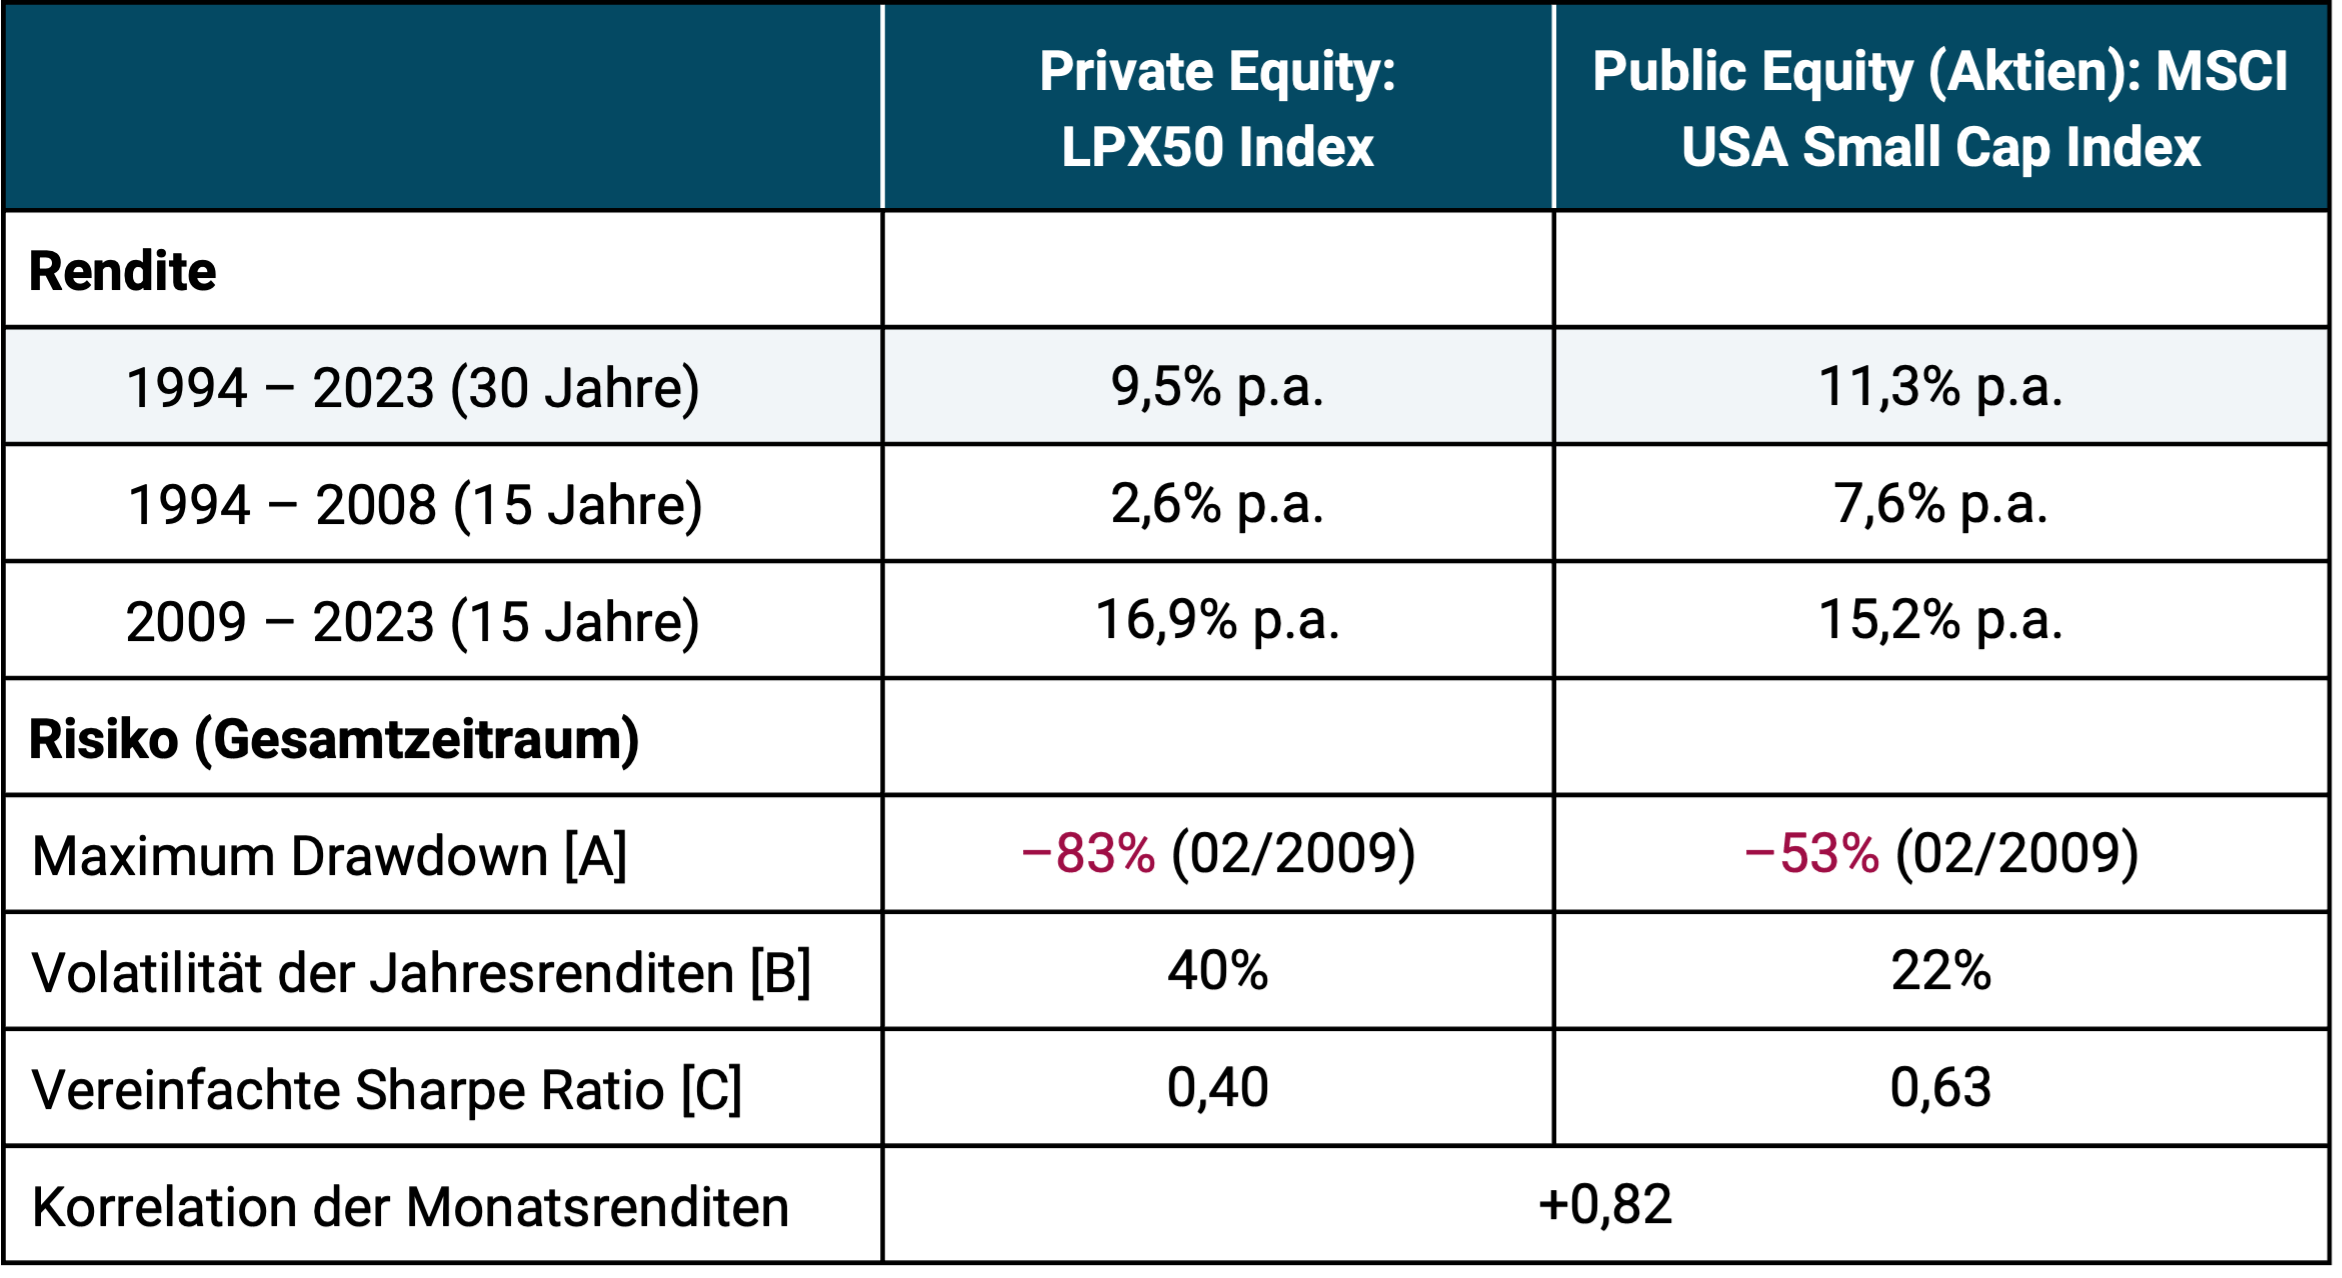
► All returns in euros, nominal, before taxes. ► Data sources: LPX AG, Dimensional Fund Advisors, MSCI. ► The LPX50 index only goes back to 1994. ►In the returns of the LPX50 index, the typical PE fund fees are between 2% and 4% p.a. a. (including performance-related fees) already included. The returns of the MSCI stock index do not include any costs (these would be in the range of 0.3% p.a. for a corresponding ETF). ► In the MSCI USA Small Cap Index column, the data for the first 5 years comes from the Dimensional US Small Cap Index, as the MSCI index only starts in 1999. ► [A] Maximum cumulative loss based on monthly returns. ► [B] Standard deviation of calendar year returns. ► [C] Arithmetic Ø of annual returns ÷ standard deviation of returns.
What can be concluded from Table 2?
Over the past 30 years, the average PE investment has underperformed a simple, passive, buy-and-hold equity investment. If you limit the analysis to the last 15 years, PE was ahead in terms of absolute returns.
However, the returns listed in Table 2 do not include the deduction for the above-mentioned cash drag problem of approximately 1.5 percentage points p.a. (see blog post on the cash drag problem here).
But either way, comparing absolute returns between PE and public equity alone is incomplete. This is illustrated by the risk indicators Maximum Drawdown and Volatility in Table 2. Because PE – when corrected for “fake volatility” – is so much riskier, it scores well Simplified Sharpe Ratio – a measure of the risk-weighted return over the entire period and both sub-periods – performs worse than a comparable equity investment. (The higher risk in PE is likely to be a consequence of the particularly heavy use of debt/leverage in the buyout sector.)
We have already mentioned that direct PE investments are very illiquid. Illiquidity is a form of risk, but it is not reflected in metrics such as volatility and maximum drawdown. Many private investors do not recognize illiquidity as a risk ex ante - or only recognize it when it is already too late, for example in the event of an unplanned early sale at a discount to the official share value.
When PE industry representatives or committed private PE investors are confronted with numbers like those in our Table 2, the following objection often comes up: “I don't invest in the average PE fund, I just pick the best ones. And in general, everything looks completely different with non-listed 'real' or 'direct' PE investments.“
Such statements seem unconvincing to us. The LPX50 index already represents above-average successful PE companies. If these companies had not had higher stock returns than the industry average over the past decades, they would not be among the 50 PE global market leaders today.
Scientific studies on PE returns at the fund level also provide little evidence for fundamentally different conclusions than those in Table 2 for the stocks of PE firms (Stafford 2020; Phalippou 2020, Li et al. 2023).
And investing in the particularly successful PE funds of the past (how else can you identify the “successful” ones?) is also likely to work poorly on balance. As has often been empirically proven with conventional investment funds, PE funds also lack convincing evidence of “performance consistency” that an investor could reliably exploit (Braun et al. 2017, Harris et al. 2023). The winning fund managers in the past are not sufficiently more likely to be among the winners again in the future than the previous losers. You cannot derive anything reliable from good figures from a PE fund or a PE manager in the past (nor can you from bad ones).
Given all this, the question arises as to why PE investments, despite their lukewarm performance over the past three decades, are now more popular with wealthy private investors than ever before.
What explains the popularity of PE investments in recent years?
In our opinion, there are eight reasons for this, which we briefly summarize below.
Reason 1: The lack of transparency of the return-risk performance of the PE industry: PE returns and PE risks are difficult for investors to understand and compare due to the unclear data situation, low regulation and volatility laundering presented here. PE representatives or salespeople can literally claim “almost anything” with presumably non-representative returns and risk figures without a normal private investor being able to find out about them.
Reason 2: The selective emphasis on the minority of individual PE investments that have been particularly successful in the past, although there is no convincing evidence that anyone can reliably pick out winning funds ex ante.
Reason 3: The manipulative focus on the last ten to 15 years, in which PE returns were higher than before. From a scientific perspective, there is no convincing reason to give greater importance to returns from the recent past than returns from the more distant past in terms of their importance for the future.
Reason 4: The claim, regularly made by the PE industry but not substantiated, let alone proven, that it is easier for non-listed companies to achieve high profitability than for otherwise identical listed companies precisely because they are not listed on the stock exchange.
Reason 5: The “seek of prestige” on the investor side. In the perception of many wealthy private investors, PE investments have an aura of exclusivity, similar to high-priced, noble consumer goods (Statman 2011). Exclusivity is incorrectly equated with quality and high returns.
Reason 6: The aspect of storytelling, of “I’m making a difference with my investment”. With PE investments, from the perspective of the individual investor, the investment looks as if he or she is financing “unique” and “exciting” investment projects together with a small group of other co-investors. The investor feels involved in a business venture, the future development of which partly depends directly on him. In his subjective perception he becomes a fellow entrepreneur. His actions “make a difference” and there is a “story” about it that he can tell at the next cocktail party or “his father-in-law”. This is a stark contrast to the anonymous role he takes on as a “merely passive” investor in the case of a conventional stock market investment or even a passive ETF.
Reason 7: The mistake of many financial journalists and finfluencers is to equate the often fairytale personal wealth of the owners of PE companies with the investment success of the customers of these companies or the entire PE industry. The wealth of PE firm owners is based on the high fees they have collected from their clients over decades. This wealth has little or nothing to do with the more normal average return on their investments.
Reason 8: The “greed to save taxes”: With a PE fund investment, the investor incurs tax loss allocations in the early years and thus temporary income tax advantages. When the opportunity to save taxes comes along, some private investors' investment brains and common sense switch off. Whether the investment generally represents a good combination of expected return, risk and liquidity then plays a minor role.
Conclusion
Over the last three decades, private equity returns have probably been lower than the general stock market, and risk in the form of volatility, maximum drawdown and illiquidity, when properly measured, has been higher. Especially when you look at return and risk at the same time, PE performs worse than comparable segments of the public equity market (stocks).
The often postulated diversification advantages of private equity in a portfolio of stocks and bonds are based on “slanted” risk reporting and are therefore likely to be an optical illusion. The fact that it is an illusion often becomes apparent in market crises or early sales for individual investors.
However, due to the PE industry's formidable marketing machine, its mixed return-risk combination will do little to change the fact that PE investments will continue to be extensively brokered to wealthy private investors in the coming years.
Endnotes
[1] One example is so-called ELTIF funds, which have been able to invest in private equity starting from 10,000 euros since 2023.
[2] In the world of listed companies (stocks), buyout targets mostly fall into the small cap range in terms of their market capitalization (enterprise value).
[3] Leveraged = (credit) leveraged.
[4] The world's largest PE firms are all listed on the stock exchange.
[5] In Germany, three ETFs were sold in September 2024 that represent PE indices similar to the LPX50.
literature
Asness, Cliff “Why Does Private Equity Get to Play Make-Believe With Prices?”; Jan 06, 2023; Institutional Investor; Internet reference here
Boyle, Patrick (2024): “How High Are Private Equity Returns?”; Sept. 2024; YouTube video; Internet link here
Callanan, Neil et al. (2024): “Private Equity’s Creative Wizardry Is Obscuring Danger Signs”; Advisor Perspectives; July 11, 2024; Internet reference here
Couts, Spencer et al. (2024) “Unsmoothing Returns of Illiquid Funds”; In: “The Review of Financial Studies”; Volume 37; Issue 7; July 2024
Braun, Reiner et al. (2017): "How persistent is private equity performance? Evidence from deal-level data"; In: Journal of Financial Economics; Volume 123; Issue 2; February 2017
Chandra et al. (2019): “Demystifying Illiquid Assets: Expected Returns for Private Equity”; AQR; Internet reference here
Harris, Robert et al. (2023): "Has Persistence Persisted in Private Equity? Evidence from Buyout and Venture Capital Funds"; In: Journal of Corporate Finance; Volume 81, August 2023
Jackson, Blake et al. (2023): “Catering and Return Manipulation in Private Equity”; Aug 18, 2023; Internet reference here
Hendrix, Kaitlin/Mamdouh Medhat (2024); “Understanding Private Fund Performance”: Dimensional Fund Advisors; July 25, 2024; SSRN; Internet reference here
Khalaf, Roula (2024): “Private equity is doing badly — however you measure it”; Financial Times; Sep 19, 2024; Internet reference here
Kommer, Gerd (2024): “Private equity is not for show-offs”; Business Week; Aug 10, 2024; Internet reference here
Kommer, Gerd/Stagnitti, Luca (2024): “The cash drag problem in private equity returns”; Dec 2024; Internet reference here
Li, Da/Timothy Riddiough (2023): “Persistently Poor Performance in Private Equity Real Estate”; May 14, 2023; SSRN; Internet reference here
Phalippou, Ludovic (2020): “An Inconvenient Fact: Private Equity Returns and the Billionaire Factory”; In: The Journal of Investing; Dec. 2020; 30; No. 1
Stafford, Erik (2021): “Replicating Private Equity with Value Investing, Homemade Leverage, and Hold-to-Maturity Accounting”; Feb 06, 2021; Internet reference here
Statman, Meir (2011): “What Investors Really Want: Know What Drives Investor Behavior and Make Smarter Financial Decisions”; McGraw Hill; 1st edition; Nov 2011; 286 pages
Stephen Stubben/Kyle Welch (2018): “Private Equity’s Diversification Illusion: Evidence From Fair Value Accounting”; Nov 07, 2018; SSRN; Internet reference here
Swedroe, Larry (2021): “Private Equity: Is There Anything Special There?”; Alpha Architect; June 22, 2023; Internet reference here