
From Gerd Kommer and Luca Stagnitti
When it comes to advantageously presenting historical returns from their financial products and investment strategies from the past, banks, asset managers, financial advisors, real estate agents and finfluencers are very creative. Almost every trick imaginable, including systematic cherry-picking of data types or time periods and manipulative omissions, is used to present one's own return on investment better than it actually is.
Because “creative return reporting” is so ubiquitous in the investment industry, among finfluencers and even among many financial journalists, Dr. Gerd Kommer addresses this topic in his book Invest confidently with index funds and ETFs a long, 15-page section dedicated to. However, it does not cover a specific cheating method, which will be the subject of this blog post. This method comes in the investment segment that has been growing rapidly for several years Private equity comprehensively applicable.
We explained what private equity (“PE”) is and what return-risk combination you can expect from PE investments in a previous blog post entitled “Private Equity – Desire and Reality” explained. Therefore, for the purposes of this article, we assume that the reader has at least a rough idea of the financial product private equity. For readers for whom this does not apply, we recommend that you first take a look at the blog post mentioned or the short entry on PE on the German Wikipedia (here).
What is the structure and process of a private equity investment?
An important structural feature of investments in a PE fund is that, from the investor's perspective, such investments are almost always made gradually in several partial amounts (tranches) - i.e. typically spread over a period of between one and five years. Figure 1 illustrates the “phase investment character” of a PE fund investment until the planned fund dissolution (liquidation) and payment of the fund assets to investors at the end of the fund term.
Fig. 1: The life cycle of a PE fund investment has three phases
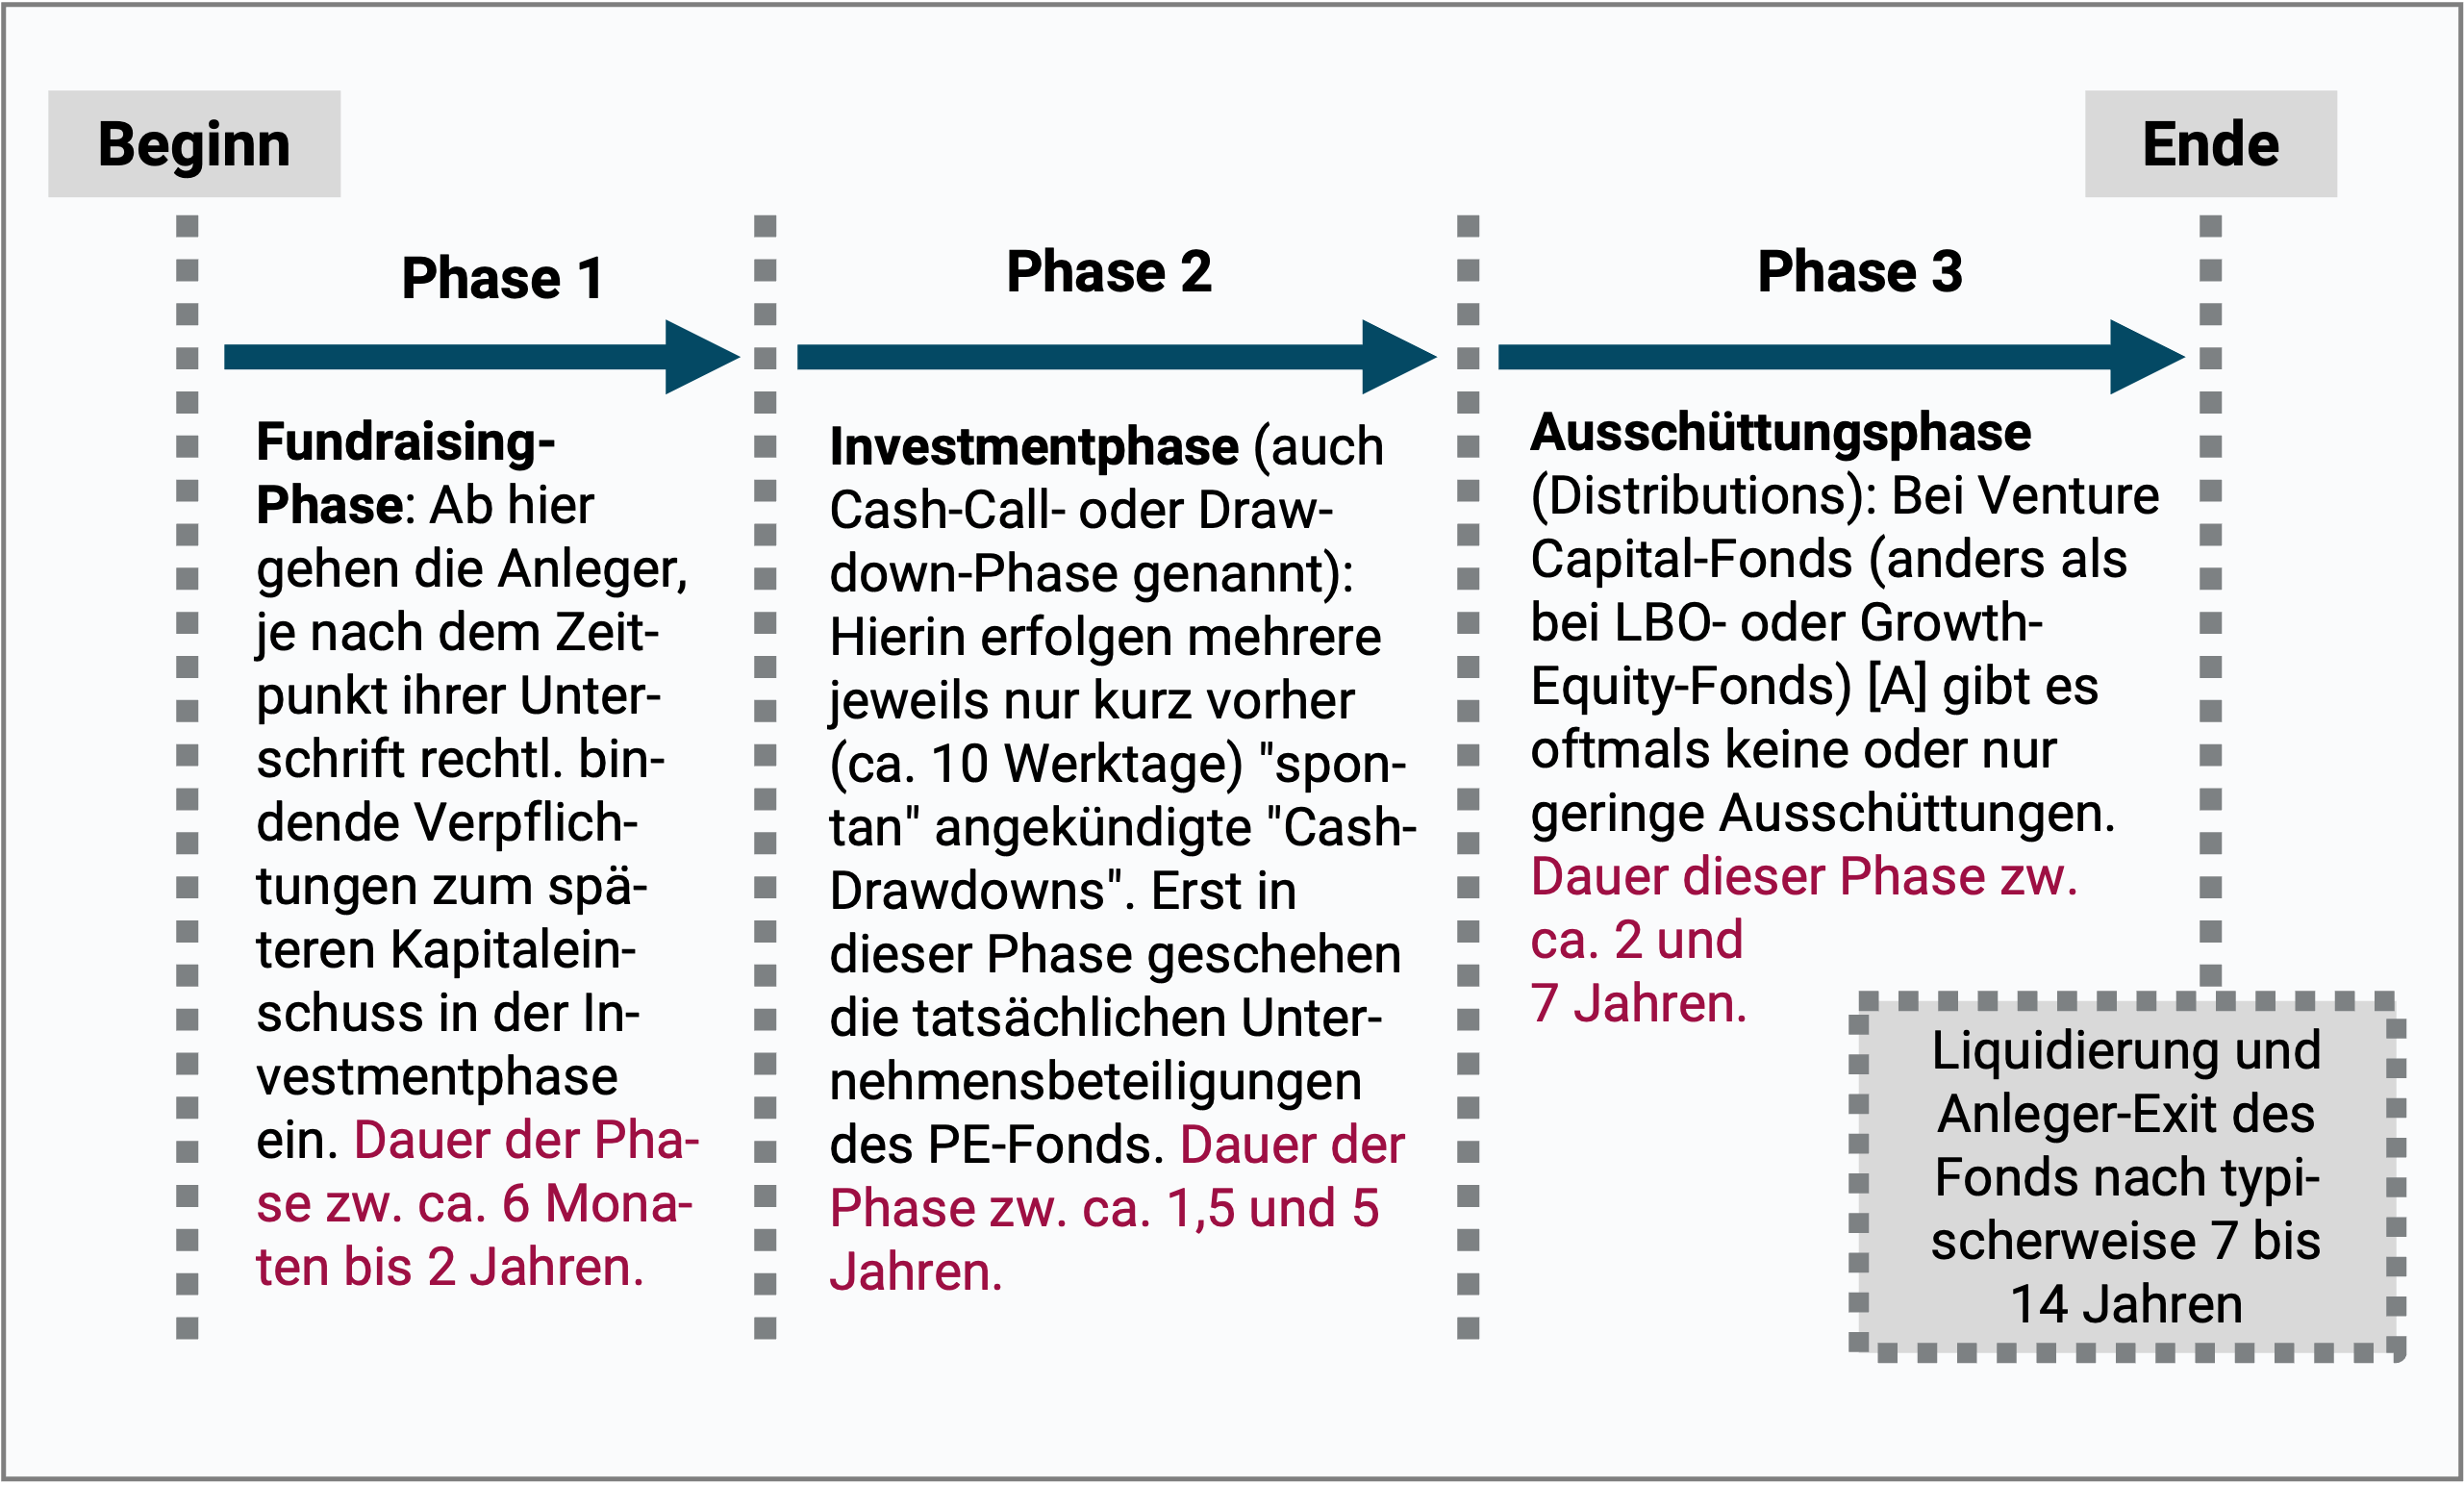
► [A] Venture Capital = venture capital, “LBO” = leveraged buy-outs and “growth equity” = growth capital are the three basic types of PE investments. Our previous blog post on PE explains these three basic types (here).
A concrete example of the process of a PE investment
Assuming investor Eduard has committed to a total investment of 500,000 euros in phase 1 (fundraising) and phase 2 (investment) lasts three years according to the fund prospectus. Eduard can then expect to receive, for example, six “cash calls” (funds) in these three years, which add up to 500,000 euros. However, the exact times, number and amount of the individual cash calls are not known ex ante. All that is known ex ante is their total amount (here 500,000 euros), the expected start and end time of the cash call or drawdown phase as well as a lower limit and possibly an upper limit for an individual call. If the general market development deviates negatively from the planning when the fund was originally launched, undesirable extensions of phase 2 and/or phase 3 may occur. These extensions are usually detrimental to returns.
If Eduard had decided to invest his 500,000 euros in the stock market (“public equity”), he could do this in one sum on the day of his very first investment decision and would therefore be fully invested from the start. Even if the 500,000 euros are not immediately available to Eduard in a different scenario, for example because he first has to sell two of his condominiums, he can adapt the execution of his stock investment completely freely, flexibly and 100% precisely to his cash inflows. There is a big difference here compared to a PE investment.
The effects of the tranche principle in private equity on returns
PE investing means investing in tranches over a longer period of time, whereby the times and amounts of the individual funds will only be roughly known in advance. This creates a “return calculation problem” as we will see in Tables 1 and 2 below.
Table 1 shows the cash flows (payment flows) of an exemplary PE fund investment of 100,000 euros - the total investment of investor Elvira - in a slightly simplified form. The planned term of the PE fund is nine years. In 2016, Elvira was one of the first investors in the twelve-month fundraising phase to “commit”, i.e. commit to the investment by signing. Fundraising will end in December 2016, as sufficient commitments of between 100,000 and five million euros have now been collected from a total of 18 investors. The four-year investment phase (Phase 2) now begins. In our simple example, four cash calls of 25,000 euros each are made for Elvira, each announced shortly beforehand, always at the beginning of the year. (Note: In reality, Elvira does not know in advance the individual amount and distribution of cash calls within the four years.) Elvira's total commitment of 100,000 euros is only fully invested at the fund level after four years.
Then follows the five-year distribution phase until the planned liquidation of the fund at the beginning of year 10. All cash flows are shown in Table 1 and a return calculation is made. Important: The return calculation perspective here is that of the PE company, i.e. the fund manager, not that of the investor.
Table 1: Example PE fund investment: The cash flows and the final return of the investor Elvira from the perspective of the PE firm (all cash flows took place on January 1st of the year)
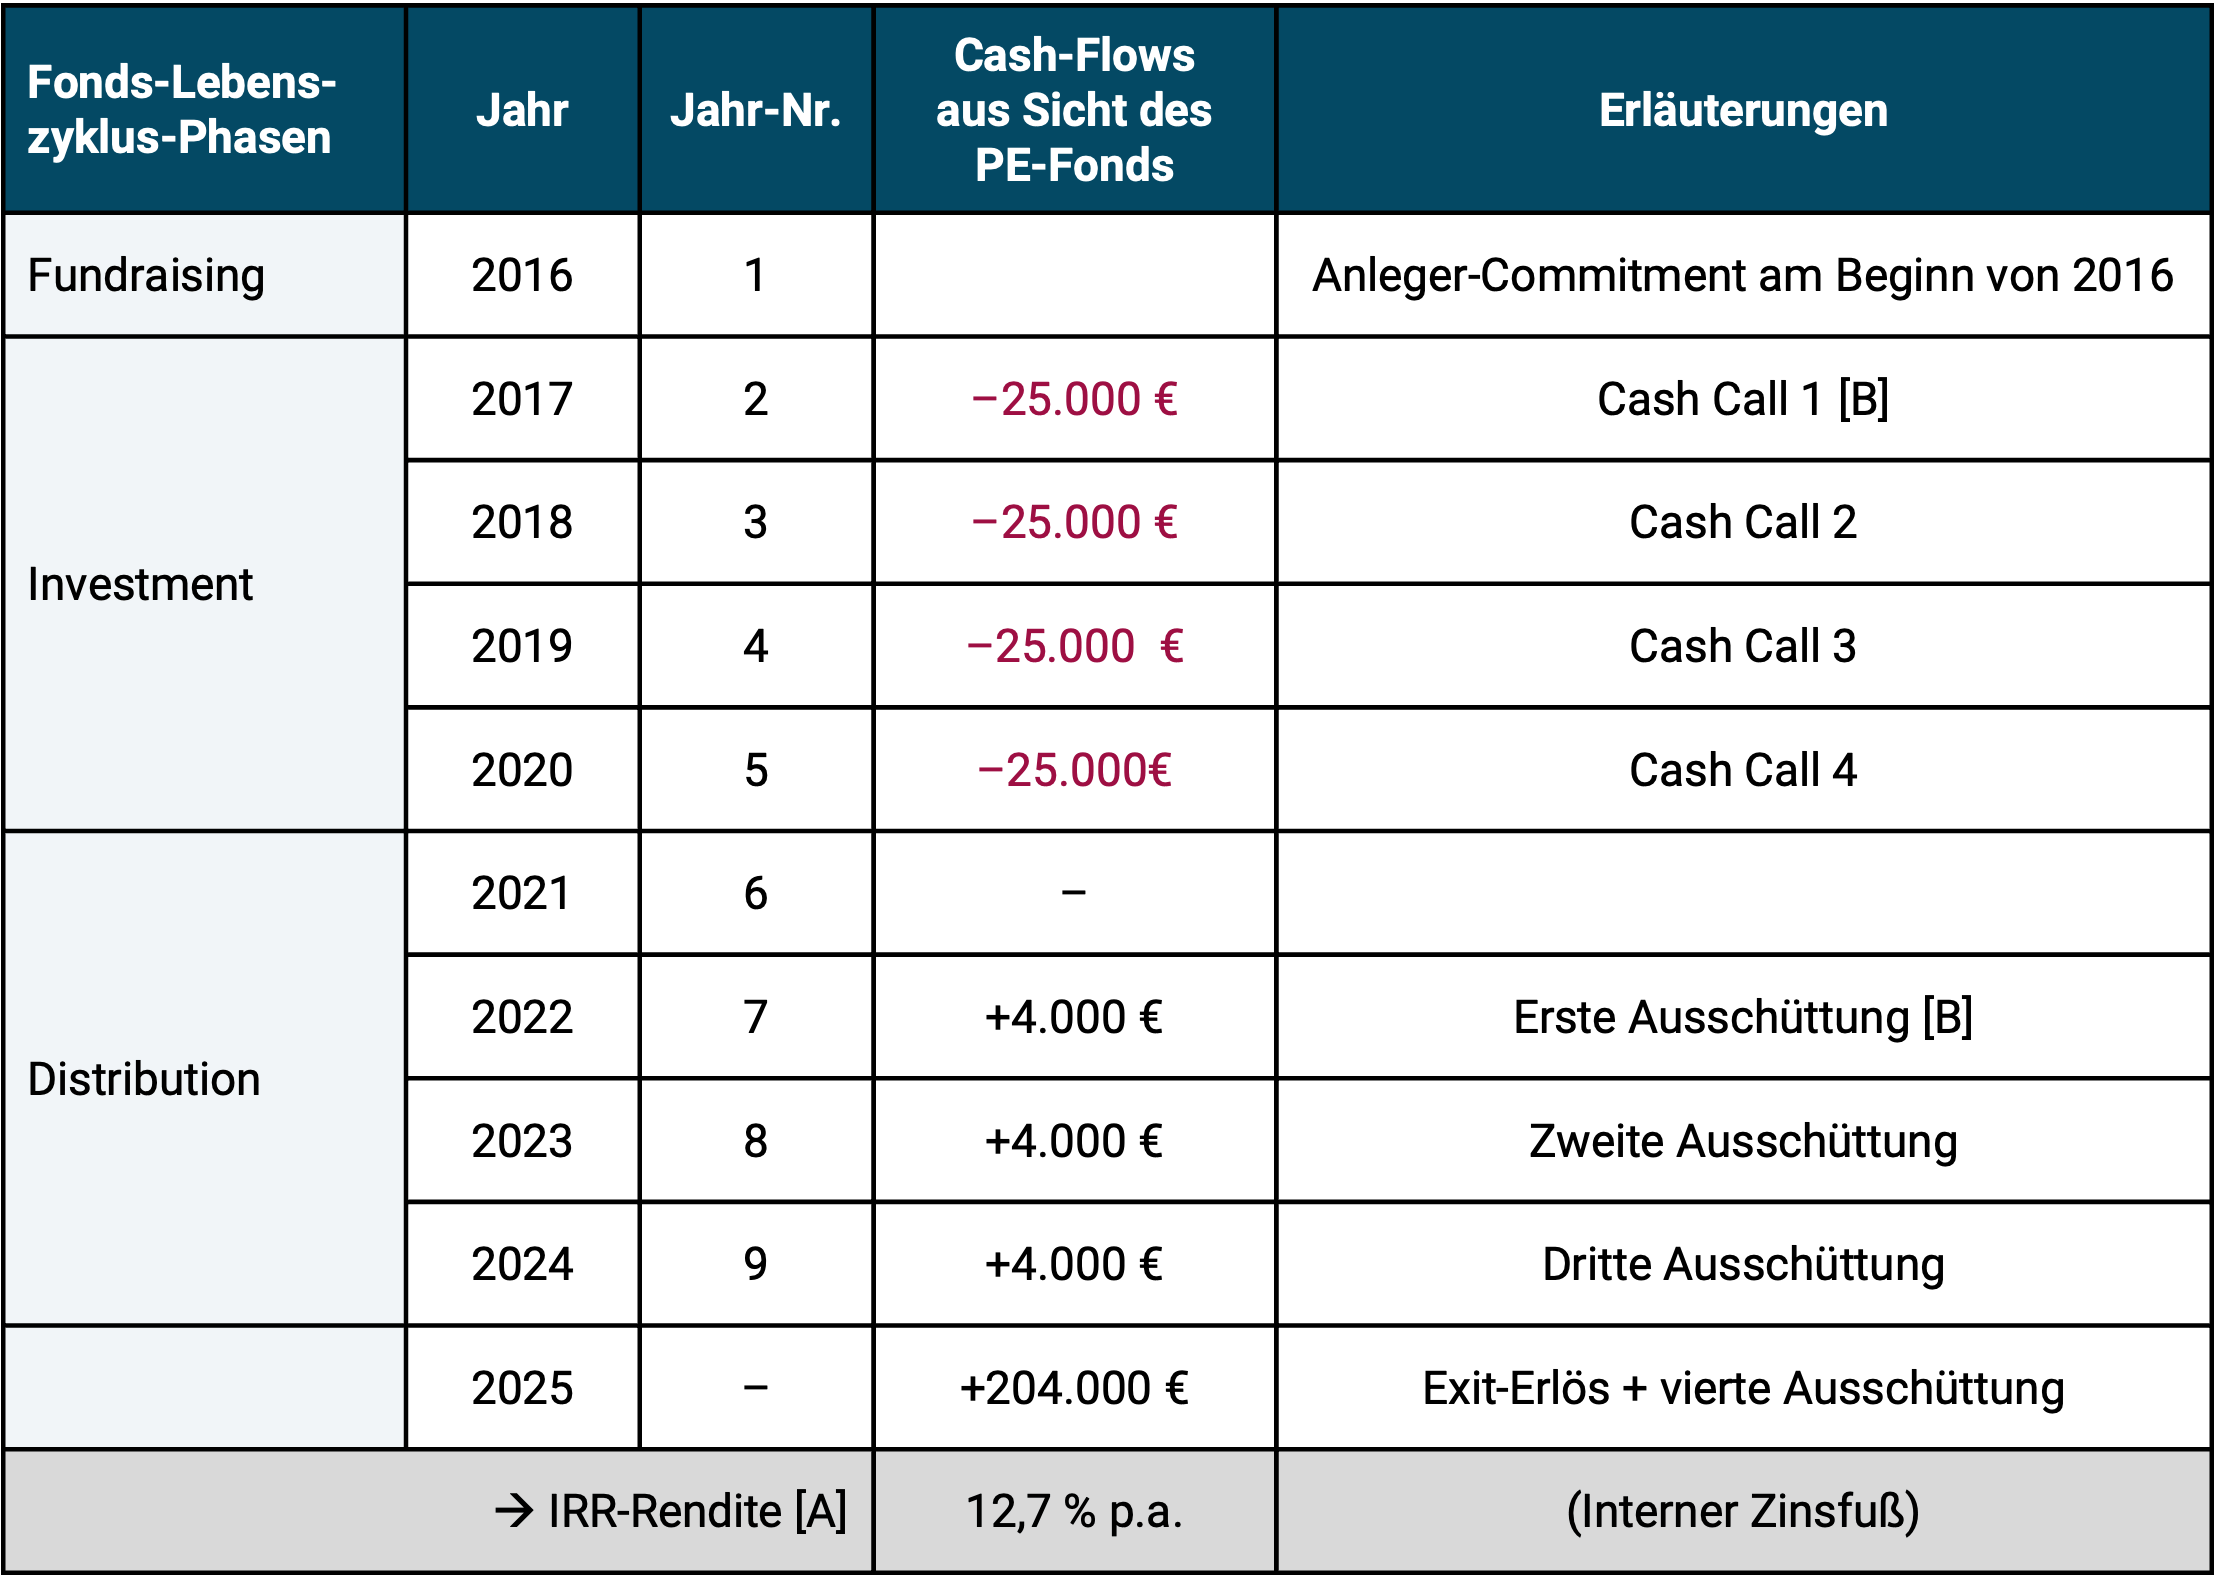
► [A] “IRR” = Internal Rate of Return. For readers who want the return ratio Internal rate of return If you don't know yet, this will be included at the end of this blog post Appendix 1 briefly explained. ► [B] In reality, all eight cash flows presented here in simplified form contain (offset) the management fees that flow to the PE company. ► Taxes not taken into account.
In the last three years of the fund's term (beginning of 2022 to beginning of 2025), Elvira will receive distributions (dividends) of 4,000 euros per year as well as exit proceeds at the beginning of 2025, the time of fund liquidation. Elvira's initial investment of 100,000 euros has doubled after nine years. In addition, she received a total of 16,000 euros in dividends.
After the fund is closed at the end of year 9, Elvira receives a final return report from the PE firm, from which she receives a return of 12.7% p.a. (before tax). Elvira is satisfied with this because, in her opinion, the number is around three percentage points above the long-term nominal average return of the stock market. However, she is a little annoyed that the 12.7% p.a. is noticeably below the fund's non-binding target return communicated to her by the PE firm nine years ago. This was 16.5% p.a.
It's just stupid that the value of 12.7% p.a. is not correct, but rather exaggerated. If Elvira is a normal private investor in the PE universe, then she won't notice this.
In Table 2 we show the reality that leads to the lower but correct return of 9.6% p.a. The negative deviation from the upwardly exaggerated return according to Table 1 results from the fact that we no longer look at the cash flows from the fund company's perspective, which is ultimately irrelevant for Elvira, but from their personal perspective - the investor's perspective. As a result, the cash flows suddenly look completely different in the first five years.
Table 2: PE fund investment: cash flows from table 1 and final return from the investor's perspective (all cash flows took place on January 1st of the year)
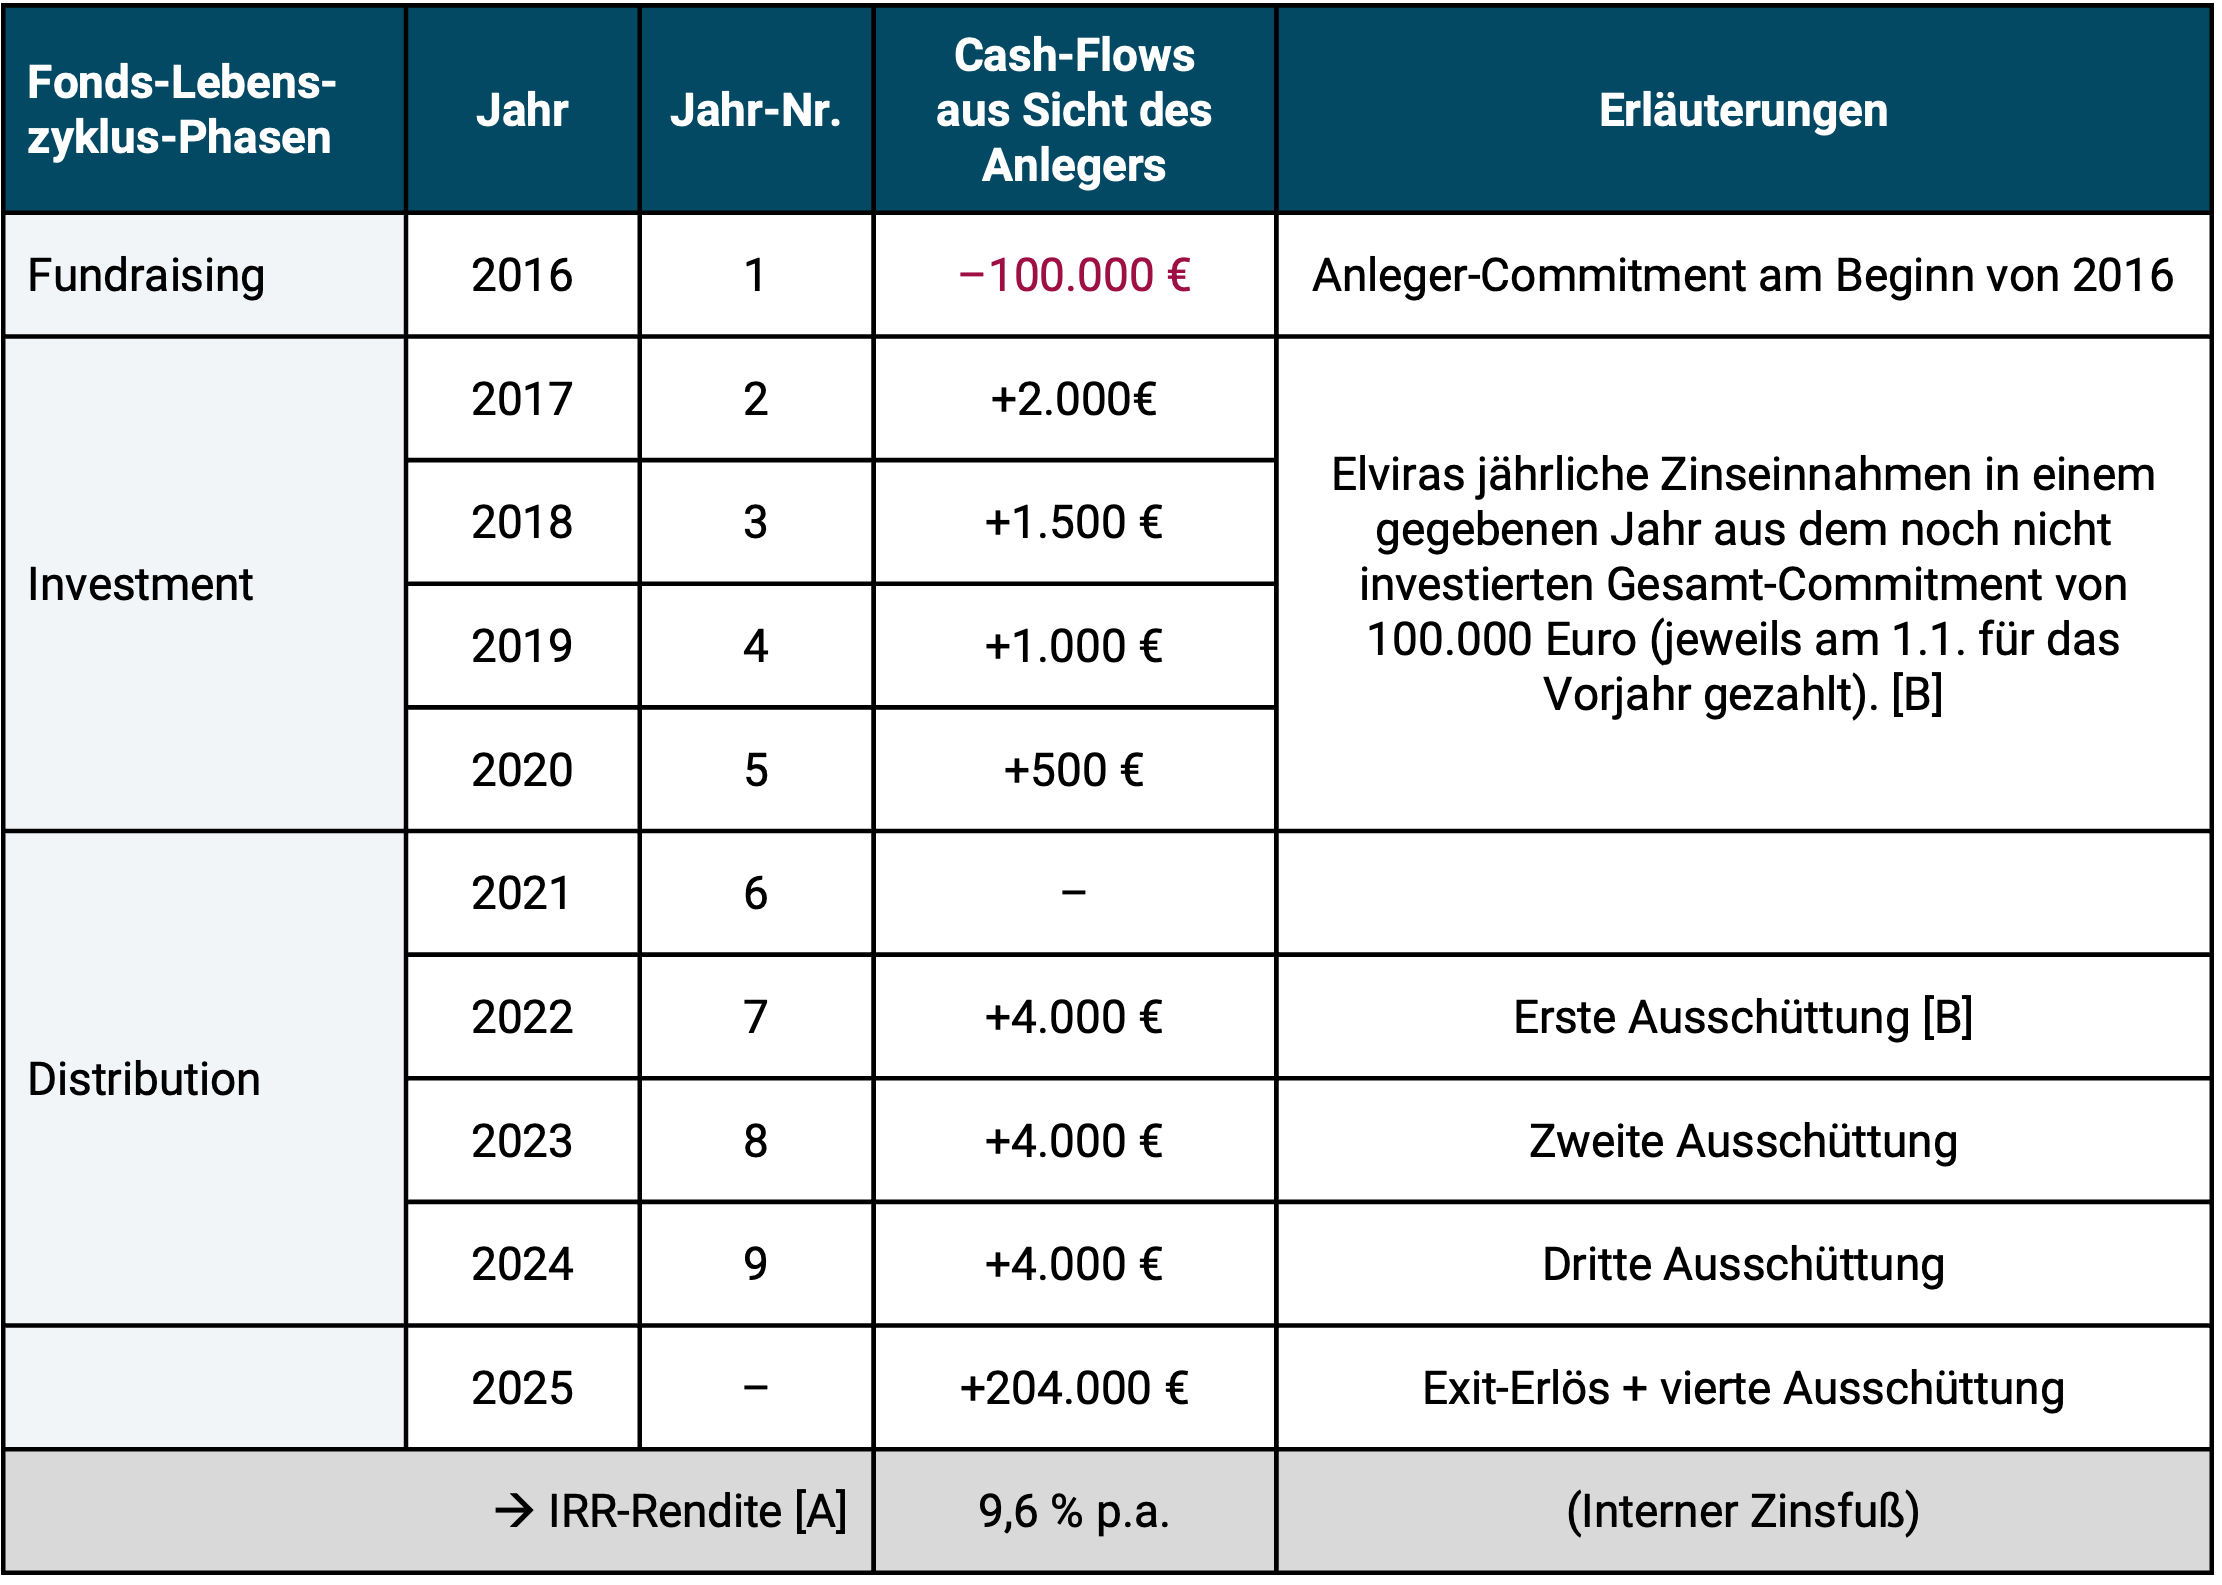
► [A] “IRR” = see brief explanation of this return figure in appendix at the end of this blog post. ► [B] In reality, all nine cash flows presented here in simplified form include (offset) the management fees that flow to the PE company. ► Taxes not taken into account.
Why do the cash flows and therefore the resulting return (IRR) in Table 2 (Elvira's perspective) differ so much from those in Table 1 (fund's perspective)?
In Table 2 we see that Elvira made the 100,000 euros available in a current account at the moment of her signature (January 2016), the time of her legally binding investment obligation, in order to be able to provide the liquidity called up on the next cash call at short notice and without risk.
Elvira reserves the said 100,000 euros in January 2016 ("Day 1") in a current account so that it is "immediately ready to transfer" until the planned cash calls over the following four years and, secondly, in the meantime, generates money market interest on the funds not yet invested in the PE fund. We have assumed the credit interest rate for this in Table 2 to be 2% p.a. The positive cash flows in the four years from 2017 to 2020 are Elvira's interest income.
From the day of her signature at the beginning of 2016, Elvira had to be “ready to transfer immediately” because (a) there is only a short period of time left until the start of the investment phase (Phase 2), probably 12 months, (b) as an investor in the fund, she cannot know at what exact time and in what amount the cash calls will come in the investment phase and (c) because there are financial penalties (“penalties”) from the fund company for the Non-honoring of a cash call exists.
Short financial mathematical excursion: If an investment involved more than just a single initial deposit (one-off investment), then how exactly the individual deposits (and withdrawals) are distributed over the entire term of the investment is of considerable importance for the correctly calculated return. Given current distributions and a given final value, the later or slower the investor had to inject his money into the investment, the higher the correctly calculated return will be. This is the main reason why the return in Table 1 exceeds that in Table 2 (see also the explanatory appendix for the return indicator “Internal Rate of Return” at the end of this blog post).
What is meant by penalties? If a PE investor fails to meet a given cash call, then he or she will be penalized financially as per the contractual agreement between him and the PE firm. How serious these penalties are for a given fund cannot be shown here for reasons of space, as the individual solutions are too individual and too diverse. The most common are high penalty interest rates. In any case, the penalties are so severe that they have a strong deterrent effect and investors therefore only fail to meet a cash call in an absolute emergency.
If the investor decides from the date of his commitment (signature) in the fundraising phase not to have a full cash investment - i.e. acts differently than Elvira - he runs the risk of return-reducing penalties and thus generally worsens the return prospects of his PE investment.
Why not just take the penalty risk?
Of course, Elvira could maintain its low-interest cash call reserve and thus its opportunity costs [1] “refuse” at the start of their commitment because they expect to obtain liquidity from other sources in good time before a cash call. If, contrary to expectations, these funds were not available in time, the investor would have three alternatives:
a) accept the contractual penalty for failing to honor one or more cash calls;
b) take out a loan yourself for temporary or permanent external financing of the cash call(s);
c) carry out the unplanned “emergency sale” of another liquid asset (e.g. stocks, bonds, fund shares, precious metals, cryptos) to finance the cash call(s).
Approach (a) is guaranteed to reduce returns in relation to the PE investment. Approach (b) means the introduction of credit leverage (“leverage”) and can both increase and decrease Elvira's investor return, but in any case makes it riskier than it would be without leverage. [2] Approach (c) statistically reduces returns in more than half of the cases with respect to the liquid investments mentioned. [3]
We have now seen that the returns reported by PE funds are skewed upwards due to the deliberate use of a “wrong” cash flow profile - namely the profile from the fund's perspective rather than the profile from the investor's perspective. The literature on biases in the published returns of PE funds and PE fund databases shows that the cash drag effect occurs together with other biases such as: B. incomplete consideration of fees, survivorship bias in the PE return databases, accepted methodological errors or arbitrariness when calculating returns and other effects amount to between one and four percentage points per annum (Phalippou 2020, Swedroe 2021, Larocque et al. 2022, Hayley/Sefiloglu 2023, Albertus/Denes 2024).
The implications for real estate investments and closed-end funds
Readers who have significant experience with real estate construction projects may have noticed, when reading this text up to this point, that the cash drag phenomenon also occurs in real estate investments with a construction phase. The return calculations made by property developers (project developers) for real estate investments with a construction phase also generally ignore the cash drag effect, similar to what the PE industry does.
When creating and calculating property price indices, the cash drag effect for new construction or renovation properties that are included in the index is also not taken into account.
The same applies to the “closed fund” type of fund that is common in Germany, which could sarcastically be referred to as “private equity for the little man” (although the providers of closed funds rarely use the label “private equity”). Closed funds invest in real estate, aircraft, ships, industrial containers, wind farms, solar parks and Hollywood films. All in all, closed-end funds in Germany have probably been a collective disaster over the past 25 years - even without the return adjustment for the cash drag effect. However, because the industry does not publish any figures, this cannot be easily proven.
Conclusion
Private equity produces less attractive return-risk combinations than the PE industry communicates to the outside world. We have shown this through our own evaluations and references to scientific studies in our blog post on PE from April 2021 - which was recently updated (here).
One of several reasons why PE returns to investors are actually lower than those reported by the PE industry for individual funds or the entire industry in the form of PE indices is the cash drag phenomenon outlined here. With this, PE providers push up their reported returns relative to the returns that investors actually realize on average by between one and two percentage points per annum - without taking into account other distortionary effects that are described in the specialist literature.
Failure to take the cash drag phenomenon into account also distorts the returns of construction phase real estate projects, closed funds and real estate indices.
Endnotes
[1] “Opportunity Cost” = Lost revenue or profits.
[2] We have written two blog posts about the numerous myths surrounding leverage in stocks and real estate investments: “Leverage stock investments with credit – does it work?” and “The credit leverage myth in real estate”.
[3] For large institutional investors, the damage to returns from the cash drag problem may be lower than for private investors because these investors have multi-person investment teams made up of professionals managing large, diversified portfolios. There are therefore more opportunities for sophisticated “cash management” (Akke et al. 2023).
literature
Akke, Ron et al. (2023): “Mechanics of fund diversification – Maximizing alpha while smoothing capital calls”; Addepar Research Brief; 2023; Internet reference here
Albertus, James/Matthew Denes (2024): “Private Equity Fund Debt: Agency Costs and Cash Flow Management”; SSRN; Nov 13, 2024; Internet reference here
Hayley, Simon/Onur Sefiloglu (2023): “Biases in Private Equity Returns”; SSRN; 09 Feb 2023; Internet reference here
Larocque, Stephannie et al. (2022): “Private Equity Performance and the Effects of Cash-Flow Timing”; In: The Journal of Portfolio Management; Vol. 48, Issue 9; 2022; Internet reference here
Meads, Chris et al. (2016): “Cash Management Strategies for Private Equity Investors”; Pantheon; 2015; Internet reference here
Phalippou, Ludovic (2020): “An Inconvenient Fact: Private Equity Returns and the Billionaire Factory”; In: The Journal of Investing; Dec. 2020; 30; No. 1; Internet reference here
Swedroe, Larry (2021): “Private Equity: Is There Anything Special There?”; Alpha Architect; June 22, 2023; Internet reference here
Appendix 1
A brief explanation of the Internal Rate of Return (IRR)
For a portfolio or portfolio that not only consists of an initial one-off investment, but into which multiple deposits or withdrawals are made (cash inflows, cash outflows) during the period under consideration (e.g. one year, five years or 20 years), the internal rate of return (IZF) or IRR is the most meaningful return measurement indicator. (In reporting by banking and neobrokers, the internal rate of return is often misleadingly referred to as “money-weighted return”.)
The main alternative to the IZF is the “geometric average return,” also called the “compound annual growth rate” (CAGR) or “annualized return.” However, this return indicator does not produce correct results in a constellation in which there was more than just an initial deposit and a withdrawal (= the final value) during the observation period. Only the IZF does that.
Think of a fund savings plan. In these cases, the geometric average return would produce erroneous results, but not the IRR. For our purposes, it is not crucial to understand the following financial mathematical IZF formula in detail:
The abbreviations have the following meaning:
BW = present value of the investment, i.e. the present value of the portfolio;
CF = cash flow (this is the annual net flow of money into or out of the portfolio - with a negative sign for CFs into the portfolio = purchases and a positive sign for CFs out of the portfolio = sales). If there are several individual cash flows in one year, these could be netted out to simplify matters. The final value of the portfolio is considered the last CF from the portfolio;
r = the internal rate of return (the formula is solved for this value);
n = the number of the last (annual) CF period that is taken into account.
In general, the IZF is the most realistic return measurement method, as multiple ongoing deposits and withdrawals during the evaluation period are the norm for private investors. In addition, the IZF also provides meaningful results in the rather rare constellations in which there are no multiple cash inflows and outflows, but only a one-off initial investment with a final asset value (or a sale) at the end of the observation period. For this “special case” the IRR and the geometric average return are identical.
Although the IZF itself is the best/most universal return calculation indicator, it is of course only possible if the cash flows that are included in its calculation are correct in terms of amount and timing. This is almost always not the case with the IRR return that PE funds communicate to their investors and the public. This is not the case because they are looking at cash flows from a fund perspective rather than from an investor perspective. Since the fund perspective does not reflect investor reality and since the fund perspective largely leads to higher returns, this can be viewed as “manipulation” in a certain way.