
<<< This blog post is also available as a YouTube video. >>>
From Alexander Weis and Gerd Kommer
This blog post complements our articles on factor investing that appeared in May and June 2019.Factor investing – the basics" and "Integrated multifactor investing" and completes our trilogy on Smart Beta Investing. Interested readers who are not yet sufficiently familiar with factor investing should read these two earlier parts first.
Factor investing, i.e. the rule-based overweighting of so-called factor premiums such as Value and Small size in a stock portfolio, has in the past led to an excess return over sufficiently long periods of time compared to “market neutral” investing, in which the market capitalization [1] of a share is used as a weighting criterion in the portfolio. (In the specialist literature, the term “market neutral” is used differently than in this blog post and usually refers to long-short strategies that aim to eliminate overall market risk.) The risk, measured in terms of volatility (intensity of fluctuation in returns), was approximately the same with factor investing as with market-neutral investing. The limitation of “sufficiently long” must be emphasized in this context, since a given factor premium does not have to be positive in every year and not even over every three, five, ten or, in the worst case, even 20-year period. Although this is not pleasant for the users of factor investing (hereinafter abbreviated as “FI”), must But ultimately it should be that way, because the additional return that can be achieved with factor premiums could otherwise be achieved risk-free - but then it would have been arbitraged away long ago.
How long can the dry spell of a factor premium be in practice? How long can it underperform compared to market-neutral investing? Perhaps the most well-known of all factor premiums, the value effect, can be used to examine this question. The value premium has been relatively bad over the last ten years and particularly bad over the last three years. For this reason and in order to keep this blog post reasonably short, we will limit our line of argument primarily to the value premium. In principle, however, our argument also applies to other factor premiums that are considered sufficiently well documented by science. In addition to value, these are primarily small size, momentum, quality, investment and political risk. Incidentally, the so-called “equity premium” (the excess return of asset class shares relative to “risk-free” money market investments) can also be negative for ten or more years (see table below).
Back to the value premium: Value stocks are companies that are cheaply valued based on certain business metrics and are often referred to in German as “substance value stocks”. Growth stocks are the counterpart to value stocks, i.e. highly valued or “expensive” stocks.
The most common metrics for classifying stocks on the value-growth spectrum are the price-to-book ratio (P/B) and the price-to-earnings ratio (P/E). These indicate how high a company's share price is in relation to the book value of its equity or earnings per share. In other words: The P/B or P/E ratio expresses how much the investor has to pay for one euro in book equity or annual profit. Over the period from 1927 to 2018, the excess return of value over growth stocks in the USA was 2.9% per year (Dimson, Marsh & Staunton, 2019).
Since around 2005, however, the performance of the value premium has left something to be desired: the MSCI ACWI IMI Value Index, the MSCI ACWI IMI Index – which we use here as a market-neutral “proxy” for the world stock market – increased by 1.4% p.a. by the end of March 2020. a. underperformed. [2] Over the three-year period from March 2017 to March 2020, the annualized under-return was as high as 5.4%.
The question therefore arises as to whether the underperformance of the value premium (the negative value premium) in the immediate past gives rise to doubts about the continued existence of the premium in the future. (For the avoidance of doubt, a negative value premium does not mean that the return of a value strategy is negative, only that the return is lower than the return of a market-neutral benchmark that, by definition, has no value “tilt.”)
If you take a look at the entire available data history of factor premiums, you will see that such dry spells are actually quite normal and have occurred many times in the long-term past. We have shown this fact in the following table using the equity, small size and value premium.
Table: Proportion of periods with negative factor premiums (US stock market from June 1927 to December 2018)
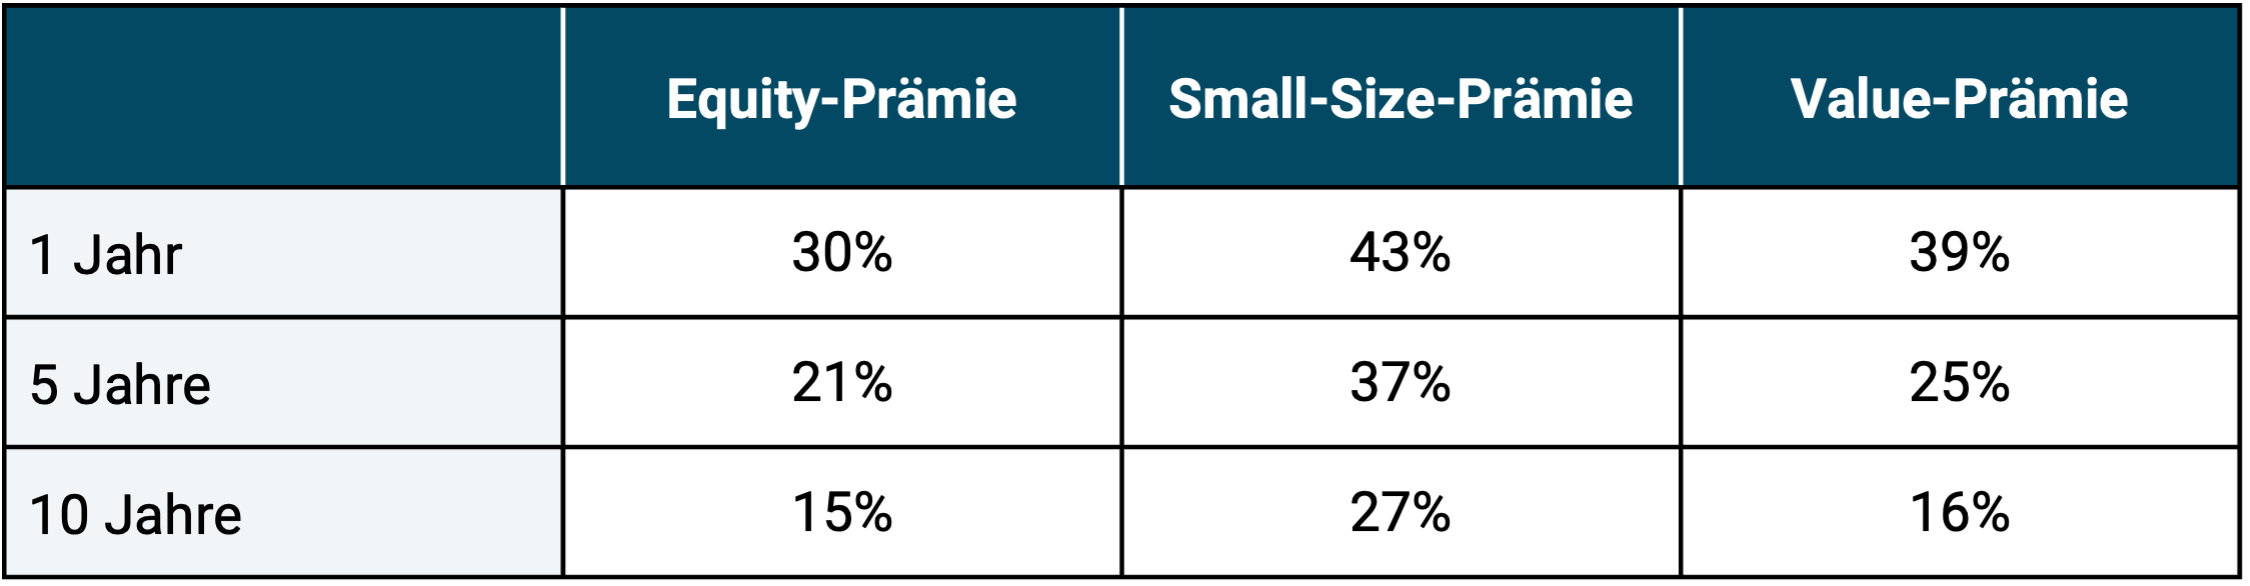
► Source: Data from Dimensional Fund Advisors, Fama & French, Ibbotson Associates, S&P, Morningstar Direct, CRSP and Compustat. ► All data before costs and taxes. ► Equity premium = stock market return minus return on the “risk-free investment” (money market return). ► Historical returns provide no guarantee that they will be repeated to a similar extent in the future.
The table makes it clear that between 1927 and 2018 there were repeated short and long periods in which individual factor premiums returned worse than their counterparts. Even the equity premium (also known as the market premium) has repeatedly been negative over time frames of ten years (and longer, which is not shown here), i.e. h. With the “savings book” you would have beaten the stock market for ten years – with far less risk (volatility).
The “death” of certain factor premiums – e.g. B. the small-size premium – has been incorrectly proclaimed several times in the past. Such “findings” are not new either.
In their 2019 paper “Volatility Lessons,” researchers Eugene Fama and Kenneth French, considered the “fathers” of FI, use US stock market data from 1963 to 2016 to show that the likelihood of the small value premium (a combination of the two premiums Small Size and Value; see also the second part of our FI blog post series entitled “Integrated Multifactor Investing”) is even higher than that of the equity premium (Fama & French, 2019). It is therefore more likely that small, low-valued companies will outperform large, expensive companies than that stocks will return better than short-term bonds with the highest credit ratings.
One assumes Regression to the mean in stock markets – which is what we do over the very long term – then below-average returns in the past tend to lead to higher returns in the future (or to put it another way: the expected return for the future is a function of the valuation level). [3] To put this in other words: low valuation levels increase the expected return of a factor premium going forward (just as the expected return for stocks as a whole is increased after a stock crash). One could therefore say that a factor premium is “cheaper” after a long dry spell and therefore has a higher expected return relative to its historical average. We have shown what this specifically meant in the past in the following graphic.
Figure: Annualized factor premiums over 10-year periods after previous 10-year periods with negative factor premiums (in the US from June 1927 to December 2018)
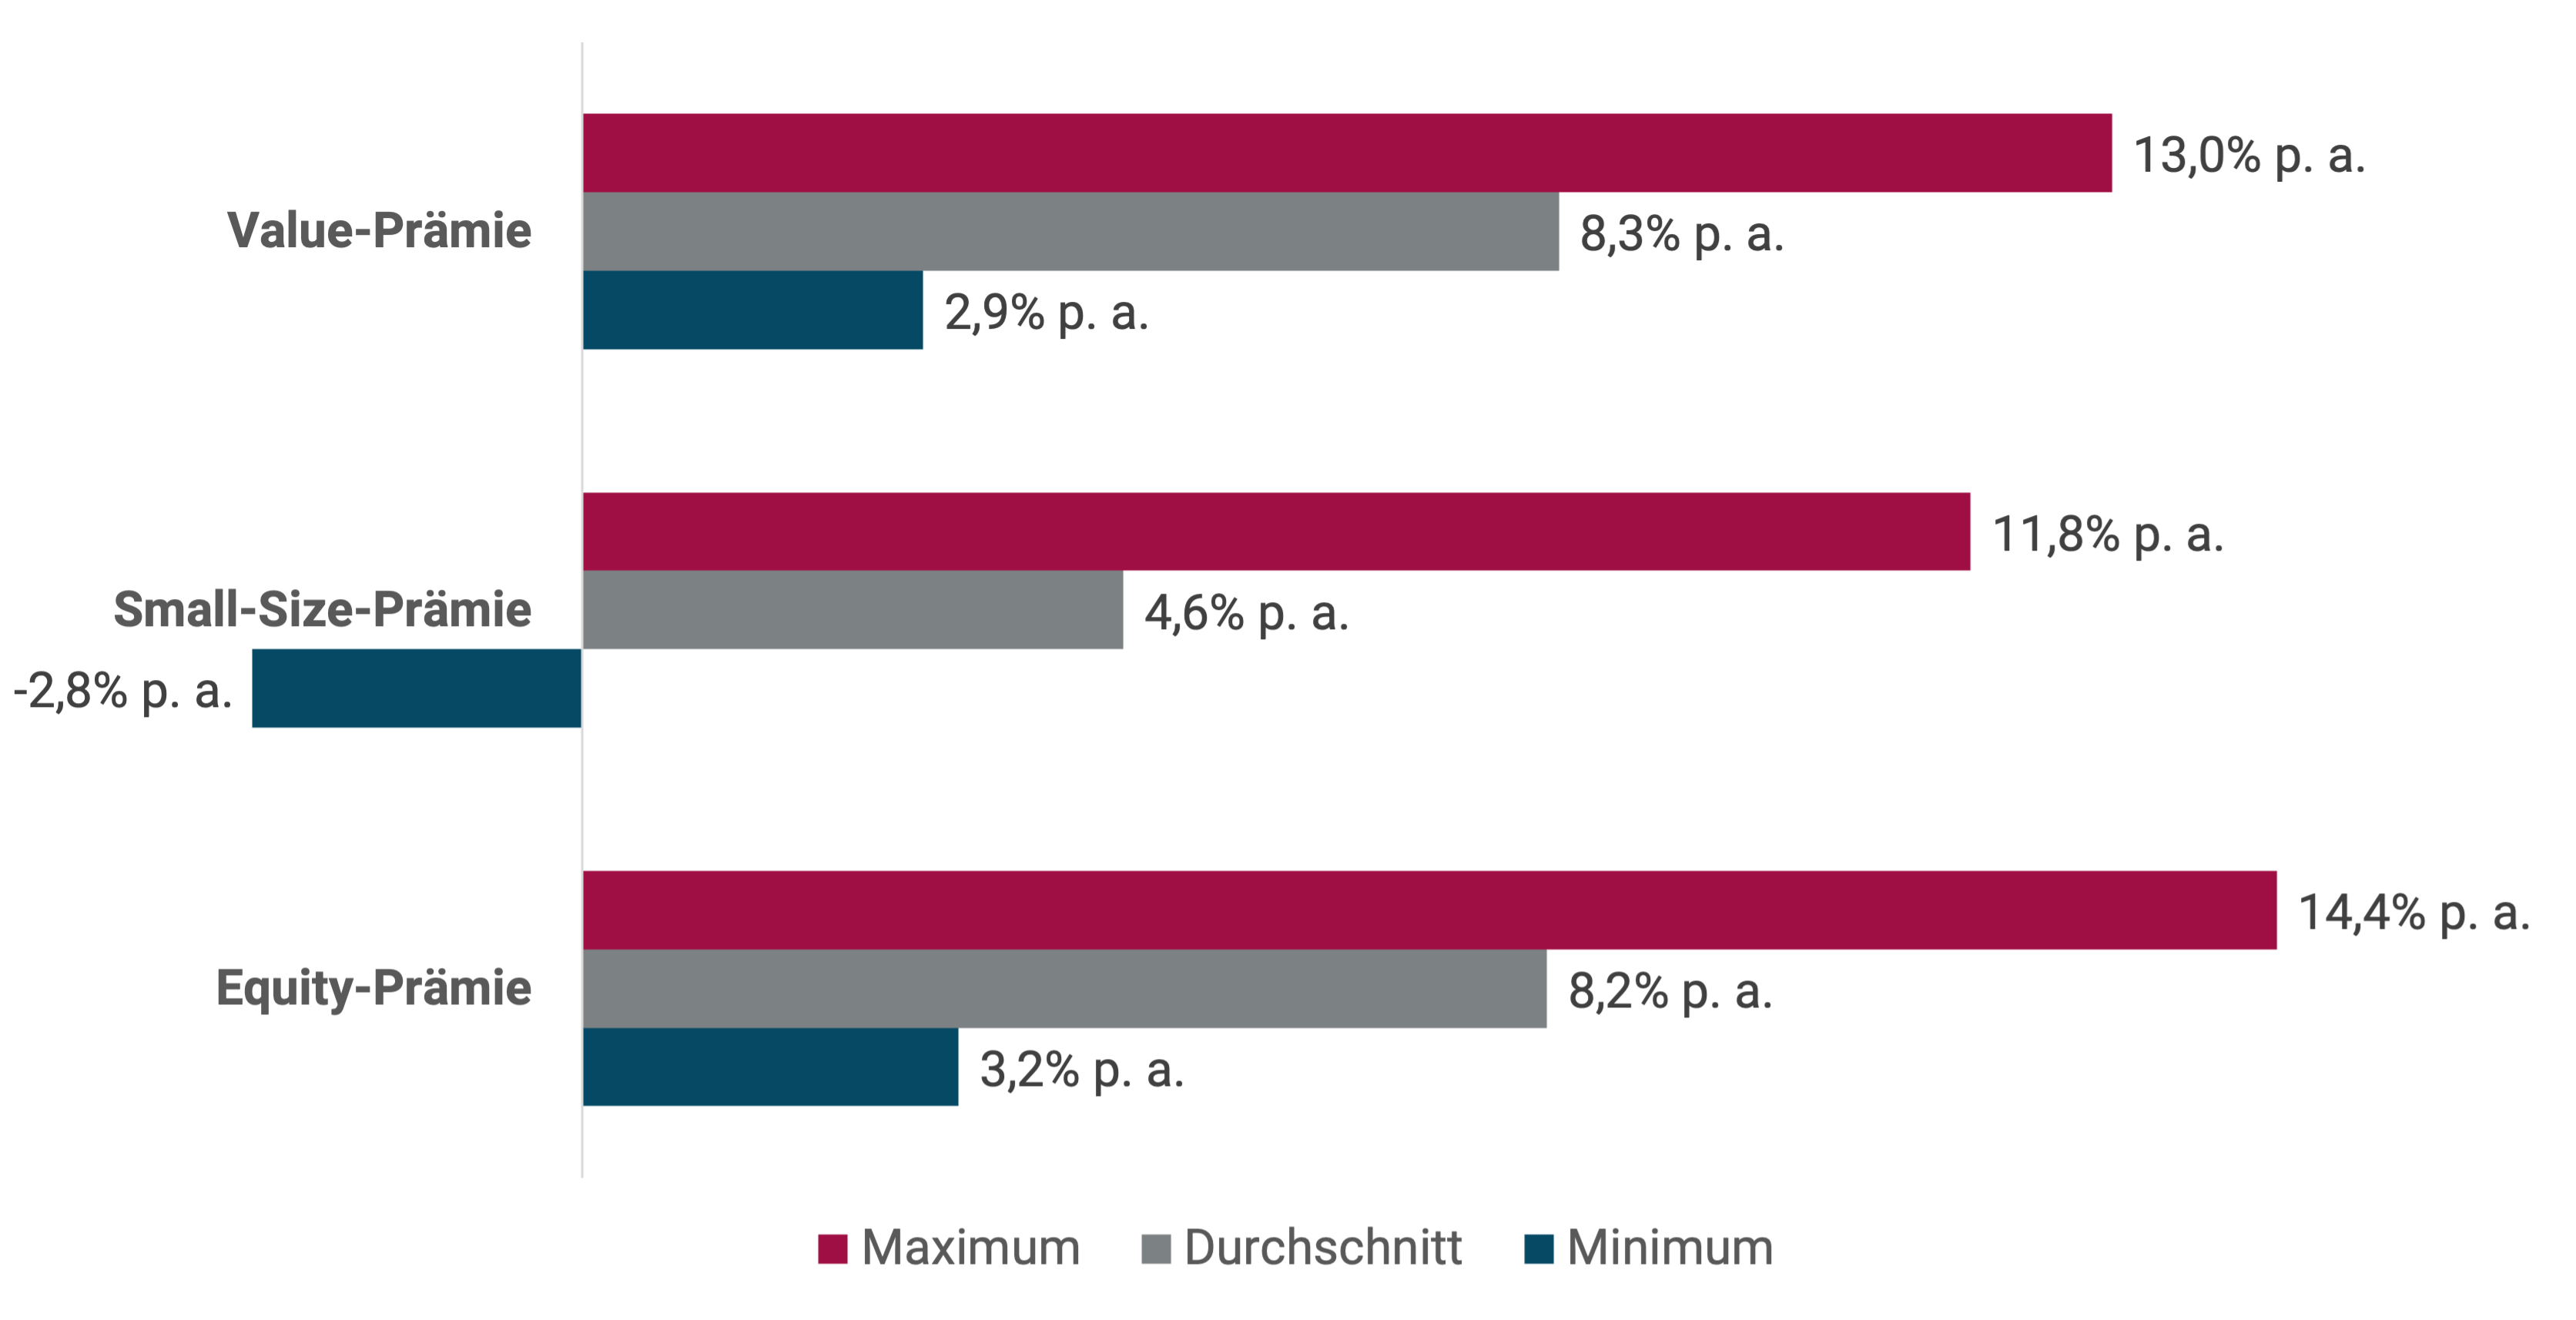
► Source: Data from Dimensional Fund Advisors, Fama & French, Ibbotson Associates, S&P, Morningstar Direct, CRSP and Compustat. ► The factor premiums are “long-only factor premiums” (see endnote 2). ► All data before costs and taxes. ► Scientific studies on historical factor premiums come to slightly different results with regard to their amount, depending on the country or region, time period and specific research methodology. ► Historical returns provide no guarantee that they will be repeated to a similar extent in the future.
The figure shows the size of the equity, small-size and value premiums in the US stock market since 1927 in the ten years following a previous negative ten-year period. This should make it clear that in the past, on average, people were richly rewarded for enduring a dry spell of a factor premium. We currently see no convincing reason why things should behave differently in the future.
Another argument for optimism about the development of the value premium in the future comes from a study by Cliff Asness of AQR Capital Management on the so-called Value Spread (Asness 2019). Put simply, the argument goes like this: If you calculate the average price-to-book ratio (“P/B”) for value and growth stocks and compare the two values to each other, this results in the value spread. Over the period from 2010 to 2017, the value spread was relatively constant, as the prices (the numerator of the P/B ratio) and the book values (the denominator of the P/B ratio) increased equally for both value and growth stocks - only more in the case of growth stocks, which contributed to the better return of growth relative to value stocks. However, in the last two years the value spread has widened noticeably. In recent decades, the only time a higher value spread has occurred was during the dot-com bubble. And immediately afterwards, Value had a particularly good phase. In summary, this suggests that value is cheaper today than it has been for a long time.
Some readers may object that it makes a difference whether you have already aligned your portfolio with the value factor premium and have therefore already suffered from the poor value performance of the last few years, or are still deciding whether you should overweight factor premiums in your portfolio. We find this objection unconvincing. In principle, the arguments presented apply equally to all investors - regardless of whether they have overweighted factor premiums in their portfolio for a long time or not. For all those who consider themselves to be among the “victims” of the underperformance of a factor premium, it seems advisable in our view to stay true to the chosen course - just as it is statistically the most profitable approach not to sell, especially after a phase of strongly negative stock market returns (i.e. a stock market crash), because at this point the expected return on stocks for the future is higher than before.
The political risk premium, i.e. the expected excess return from emerging market stocks compared to industrial country stocks, has fared just as badly as the value premium over the past decade. Strangely enough, unlike the value premium, you rarely hear in the specialist media that you should or should give up investing in emerging markets because of this.
The factor premiums have Quality, Momentum and Minimum Volatility Market neutral in each of the last five and ten years (including the current Corona crash) significantly outperformed (on the conservative “long-only basis”, see endnote). [2]).
The most important conclusion from everything said here does not only apply to factor investing: judging a well-thought-out, correctly executed, scientifically oriented investment strategy based solely on its results over a one-, five- or ten-year period often leads to false conclusions. These periods are simply too short (the data sample is too small) to achieve a reliable result using the strategy.
This is also illustrated by the following fact: In the 17 years from 1991 to 2007, Munich residential properties suffered a price decline of 40%, adjusted for inflation - a “slow-motion crash” that has already been forgotten today. It should also be borne in mind that loan interest rates during this period were on average over five percentage points higher than today. Anyone in 2006 or 2007 who took this long dry spell of completely unattractive and many years of negative real estate returns in Munich and (even more extreme) other cities as an opportunity to sell their real estate portfolio or never invest in Munich real estate again missed out on a spectacular real estate bull market that began at the beginning of 2008.
Conclusion
In the past, factor investing has led to attractive additional returns compared to a market-neutral benchmark over sufficiently long periods of time. Nevertheless, there were always periods of five, ten or 15 years in which a given factor premium was negative, i.e. it performed worse than market neutral or its counterpart. In our opinion, this isolated circumstance cannot be seen as evidence of the final disappearance of the corresponding factor premium. Such long dry spells are probably a manifestation of the very risk that makes factor premiums possible in the first place. In the very long term, this risk should be compensated for by an increased return.
Because this is the case, you should never put everything on one horse when it comes to factor investing and should therefore diversify across several well-researched, well-documented factor premiums. We explain how to do this in the other two blog posts in our series on factor investing „Factor investing – the basics" and "Integrated multifactor investing“ explained.
In general, only those investors who understand it should engage in factor investing. This means knowing and accepting the historical factor investing data (including premium fluctuations), finding the logic behind factor investing convincing and the subjective “reference frame risk” (the underperformance of a relevant reference index, which often lasts for several years) that comes with factor investing.
Endnotes
[1] The market capitalization (also called market capitalization or stock market value) of a public company is the share price multiplied by the number of shares outstanding (the market value of the company's equity).
[2] We use so-called long-only premiums in the underlying calculation. This is the conservative calculation method and the one that is relevant for retail investors in ETFs (for an explanation of the concept of long-only premiums, see the first of our three blog posts on factor investing).
[3] In our experience, this scientifically undisputed finding is repeatedly misunderstood to mean that valuation-driven market timing makes sense. However, such a conclusion cannot be derived from the statement “the expected return is a function of the valuation level” alone, because this (false) timing thesis ignores the opportunity costs of market timing before any market entry triggered by a favorable valuation.
literature
Asness, Cliff (2019): “It’s Time for a Venial Value-Timing Sin”; Internet reference: https://www.aqr.com/Insights/Perspectives/Its-Time-for-a-Venial-Value-Timing-Sin
Baltussen, Guido; Swinkels, Laurens; Van Vliet, Pim (2019): “Global Factor Premiums”; Internet reference: https://papers.ssrn.com/sol3/papers.cfm?abstract_id=3325720
Deere, Robert (2017): “Understanding the Performance of Small Cap Stocks”; Dimensional Fund Advisors; Working Paper; Unpublished
Dimson, Elroy; Marsh, Paul; Staunton, Mike (2019): “Credit Suisse Global Investment Returns Yearbook 2018”; long version; Credit Suisse Research Institute; 256 pages
Fama, Eugene; French, Kenneth (2019): “Volatility Lessons”; Financial Analysts Journal; 74.3; pages 42-53
Jacobs, Heiko; Müller, Sebastian (2020): “Anomalies across the globe: Once public, no longer existing?” In: Journal of Financial Economics; 135 (2020); pages 213–230
Kommer, Gerd; Weis, Alexander (2019): “Integrated Multifactor Investing”; blog post; June 2019; Link: https://www.gerd-kommer-invest.de/integrated-multifactor-investing/
Kommer, Gerd; Weis, Alexander (2019): “Factor Investing – the Basics”; blog post; May 2019; Link: https://www.gerd-kommer-invest.de/factor-investing-die-basics/