
From Gerd Kommer and Jakob Riemensperger
Over the last ten years, gold has had an extraordinarily high return, which significantly exceeds the historically high return of the global stock market. Silver has outperformed both stocks and gold over the past decade.
Not surprisingly, media reports about gold and silver as investments have recently increased significantly.
At the end of January 2026, there was a brief price drop of 15% for gold and silver and almost 40% for silver (measured in euros). But both break-ins were only a short “scare moment”. So far they have remained lower than the price increases in the previous three weeks.
Reason enough for us to examine the question of the attractiveness of gold and the other three most important precious metals from an investor's perspective - silver, platinum and palladium - in this blog post. The focus of our analysis is on long-term historical data, supplemented by central factual arguments.
As we will see, the parallel analysis of the four most important precious metals in terms of investment alongside each other provides interesting insights and findings that an isolated examination of just gold or just silver would not have provided. (For gold individually, we already have a similar consideration, including a literature review, in an earlier one Blog post made.)
Before we start presenting the return data, here are some general real economic facts about the four precious metals that may not be known to everyone:
Table 1: Selected key real economic data for four precious metals
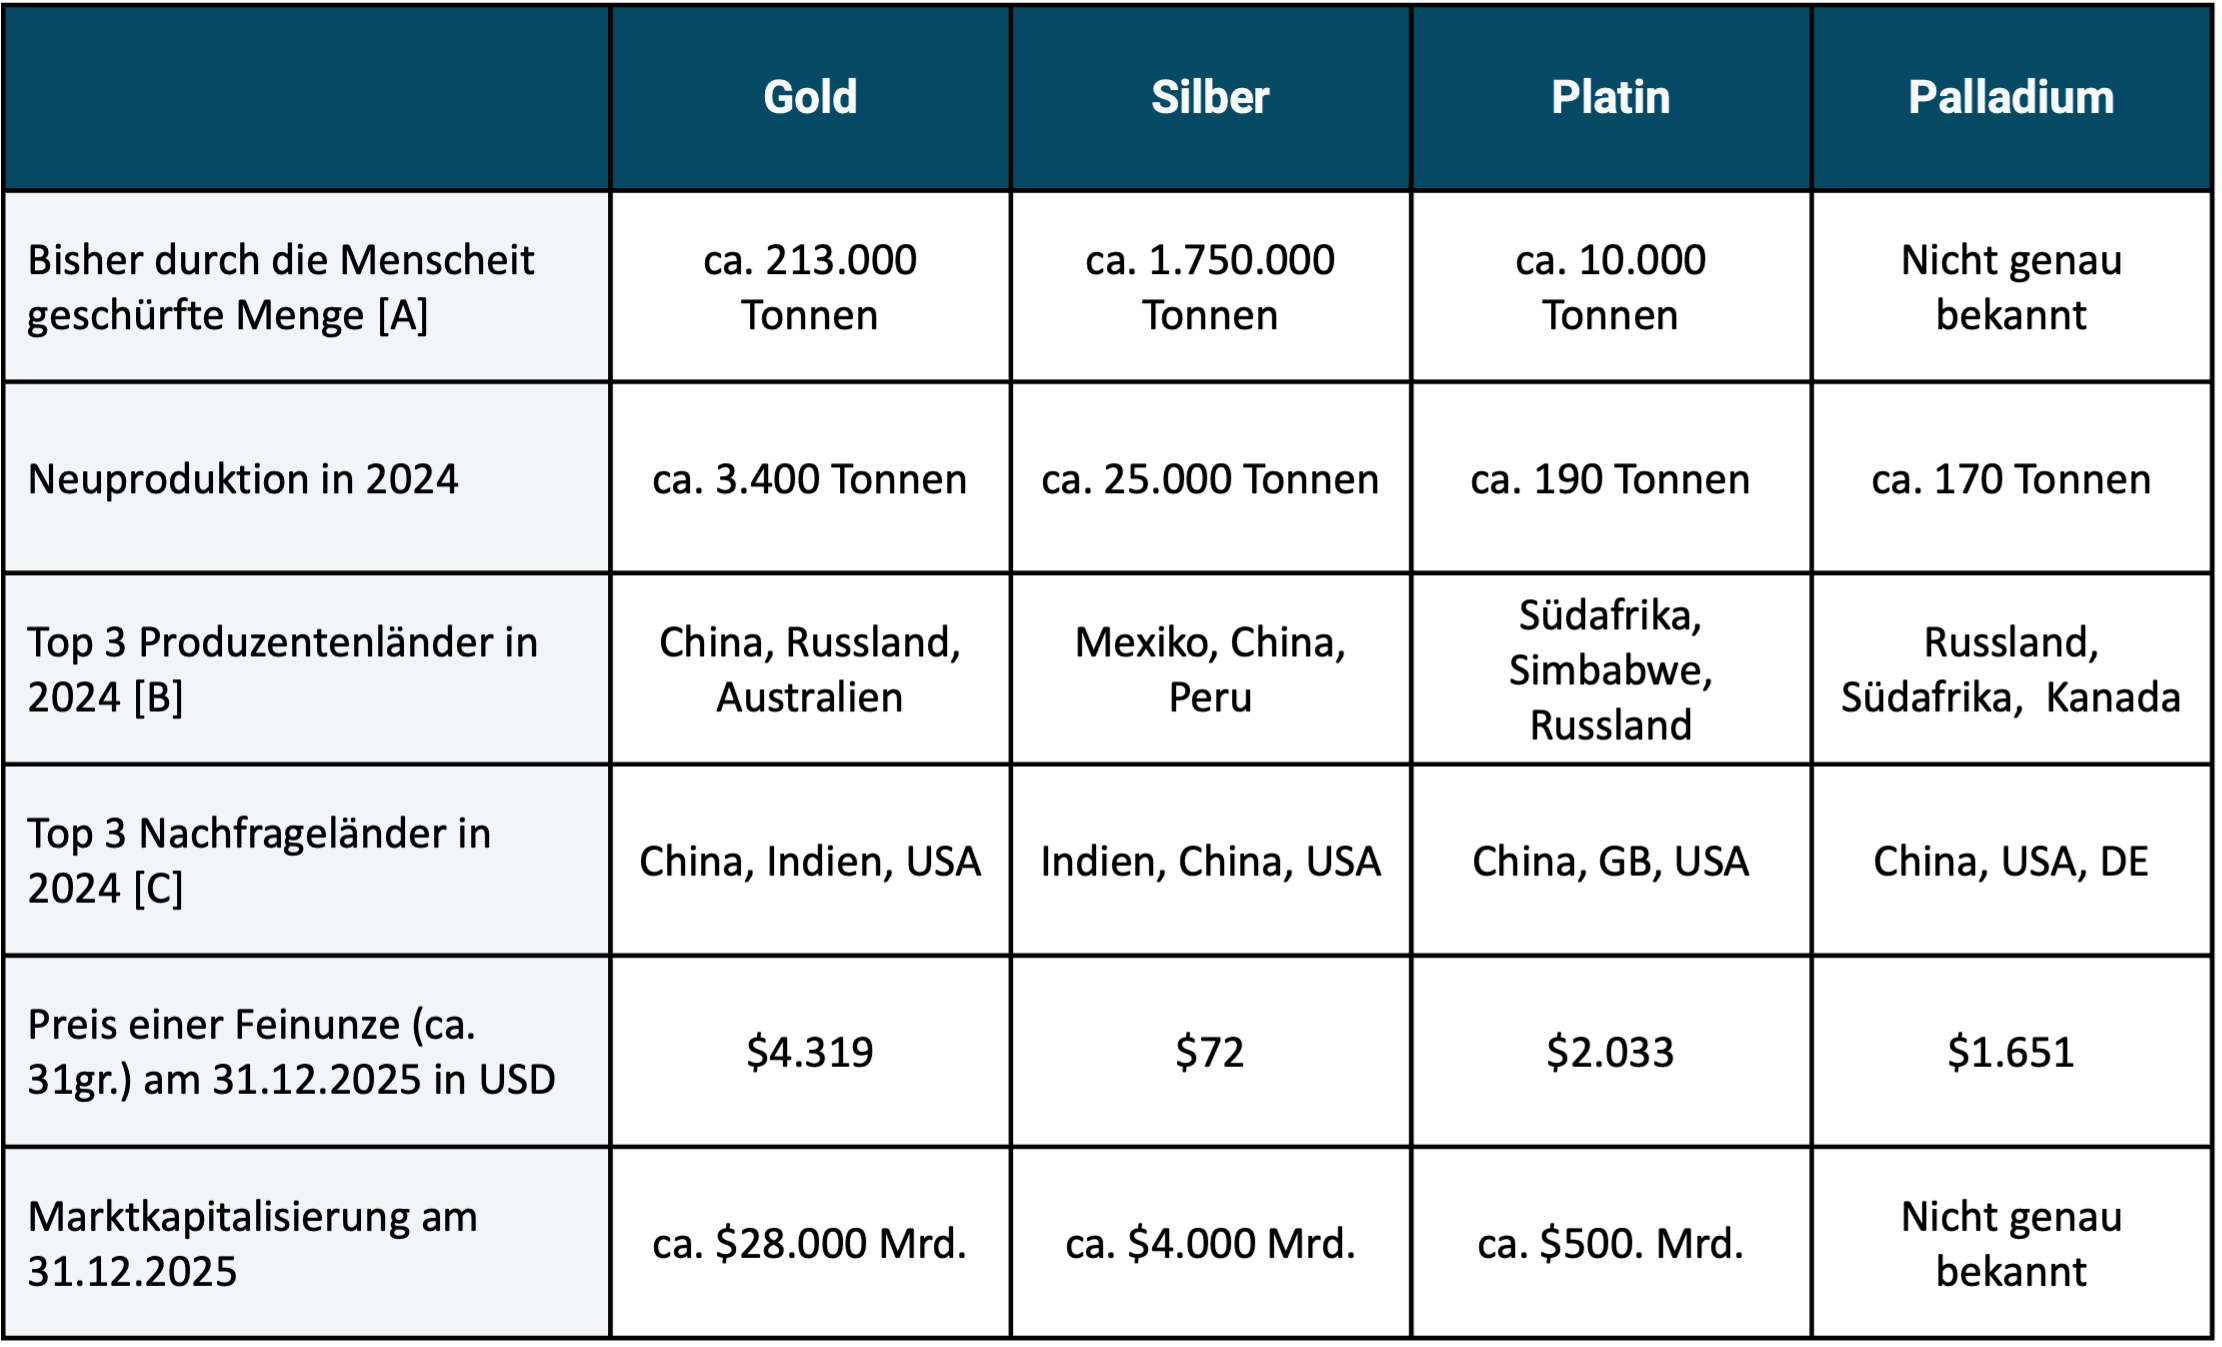
► All weight figures given are rough estimates from a number of different sources. ► [A] The volume that exists worldwide today and has been removed from the earth's crust by humans (“above ground stock pile”). ► [B] In order of production volume. ► [C] In order of demand volume.
There are a total of 15 precious and semi-precious metals. Curiously, according to Wikipedia, these two terms are not exactly the same in different cultures and languages, so they sometimes include different metals.
In investing practice, gold is the most important precious metal, which will surprise no one. In addition to gold, silver, platinum and palladium, the eleven other precious and semi-precious metals not discussed further in this blog post only play marginal roles in the investment market. [1]
Institutional investors and central banks essentially only invest in gold and little or no investment in silver, platinum and palladium.
The market capitalization of precious metals is small compared to that of the stock market and the bond market (see bottom row of Table 1). At the end of 2025, the global stock market had a market capitalization of approximately $130,000 billion (more than four times that of gold), the bond market had a market capitalization of $140,000 billion. At the end of 2025, Bitcoin had a market cap of approximately $1,700 billion (approximately one percent of that of the stock market).
As a private investor in Germany, you can easily invest in the four precious metals via ETFs, more precisely “ETCs” (Exchange Traded Commodities). The advantage of precious metal ETCs relative to direct investments is lower transaction costs (additional costs for buying and selling) with investment amounts (quantities) that are normal for private investors. Furthermore, with ETCs there are no costs for locker rental and insurance. They also offer greater convenience and operational security relative to direct investments. For example, the risk of loss due to theft or negligence is lower in the case of precious metal ETCs than with direct investments. Trading also takes place faster, which makes rebalancing in the overall portfolio easier. The costs (Total Expense Ratios/TERs) of the cheapest ETCs are reasonable. In the case of gold ETCs, they are particularly low.
Taxes on precious metal investments
For tax purposes, direct investments in all four precious metals in Germany are treated equally for private investors. There is tax exemption after a holding period of one year (“private sale transaction” according to Section 23 EStG); if sold before the end of 12 months, the normal income tax rate applies.
ETCs that physically hold the respective precious metal and include a so-called delivery claim (which is the case with many, but not all, precious metal ETCs sold in Germany) are treated just as favorably for private investors for income tax purposes as a direct investment.
Purchases of direct investments by private investors in silver, platinum and palladium are (unlike gold) subject to sales tax, i.e. 19% sales tax is due on the purchase. Precious metal ETCs do not have this disadvantage. (When selling direct investments, a private investor does not have to collect sales tax from the buyer.)
Silver, platinum and palladium are used industrially on a large scale, so they are real “raw materials”, not just pure investments. Apart from its use as a decorative metal, gold has virtually no commercial use. However, it is doubtful whether “jewelry” can be classified as “commercial/industrial use” at all, since in the two main demand countries for gold jewelry – India and China – it tends to play the same role in the population that gold bars and gold coins have in Western countries.
All three industrially used precious metals and gold are so valuable per unit of weight that the quantities once produced (mined) no longer disappear (e.g. in the trash), but remain permanently in circulation (stock) through recycling.
The historical returns of the four precious metals
Let's move on to the investment aspect. Figure 1 shows the inflation-adjusted increases in the value of the four precious metals and the MSCI World stock index over the 49 years from the beginning of 1977 to the end of 2025. We chose the starting point in 1977 because monthly return data for palladium are only available from this point on. But even for gold, a historical investment analysis couldn't go back much further than 1977. Return data for gold before 1975 is ultimately not meaningful, as it was only at the end of 1974 that the decades-long Gold ban [2] was repealed in the USA. The corresponding gold bans in the countries China and India, which are extremely important for global gold demand, remained in place for a number of years after 1974. (Until the end of 1971, the price of gold in US dollars was set by the American government in the context of the so-called Bretton Woods monetary system, which resulted in a return in dollars of close to zero.)
Figure 1: Inflation-adjusted indexed price development of gold, silver, platinum, palladium and stocks (MSCI World Index) from 01-1977 to 12-2025 (49 years) in USD
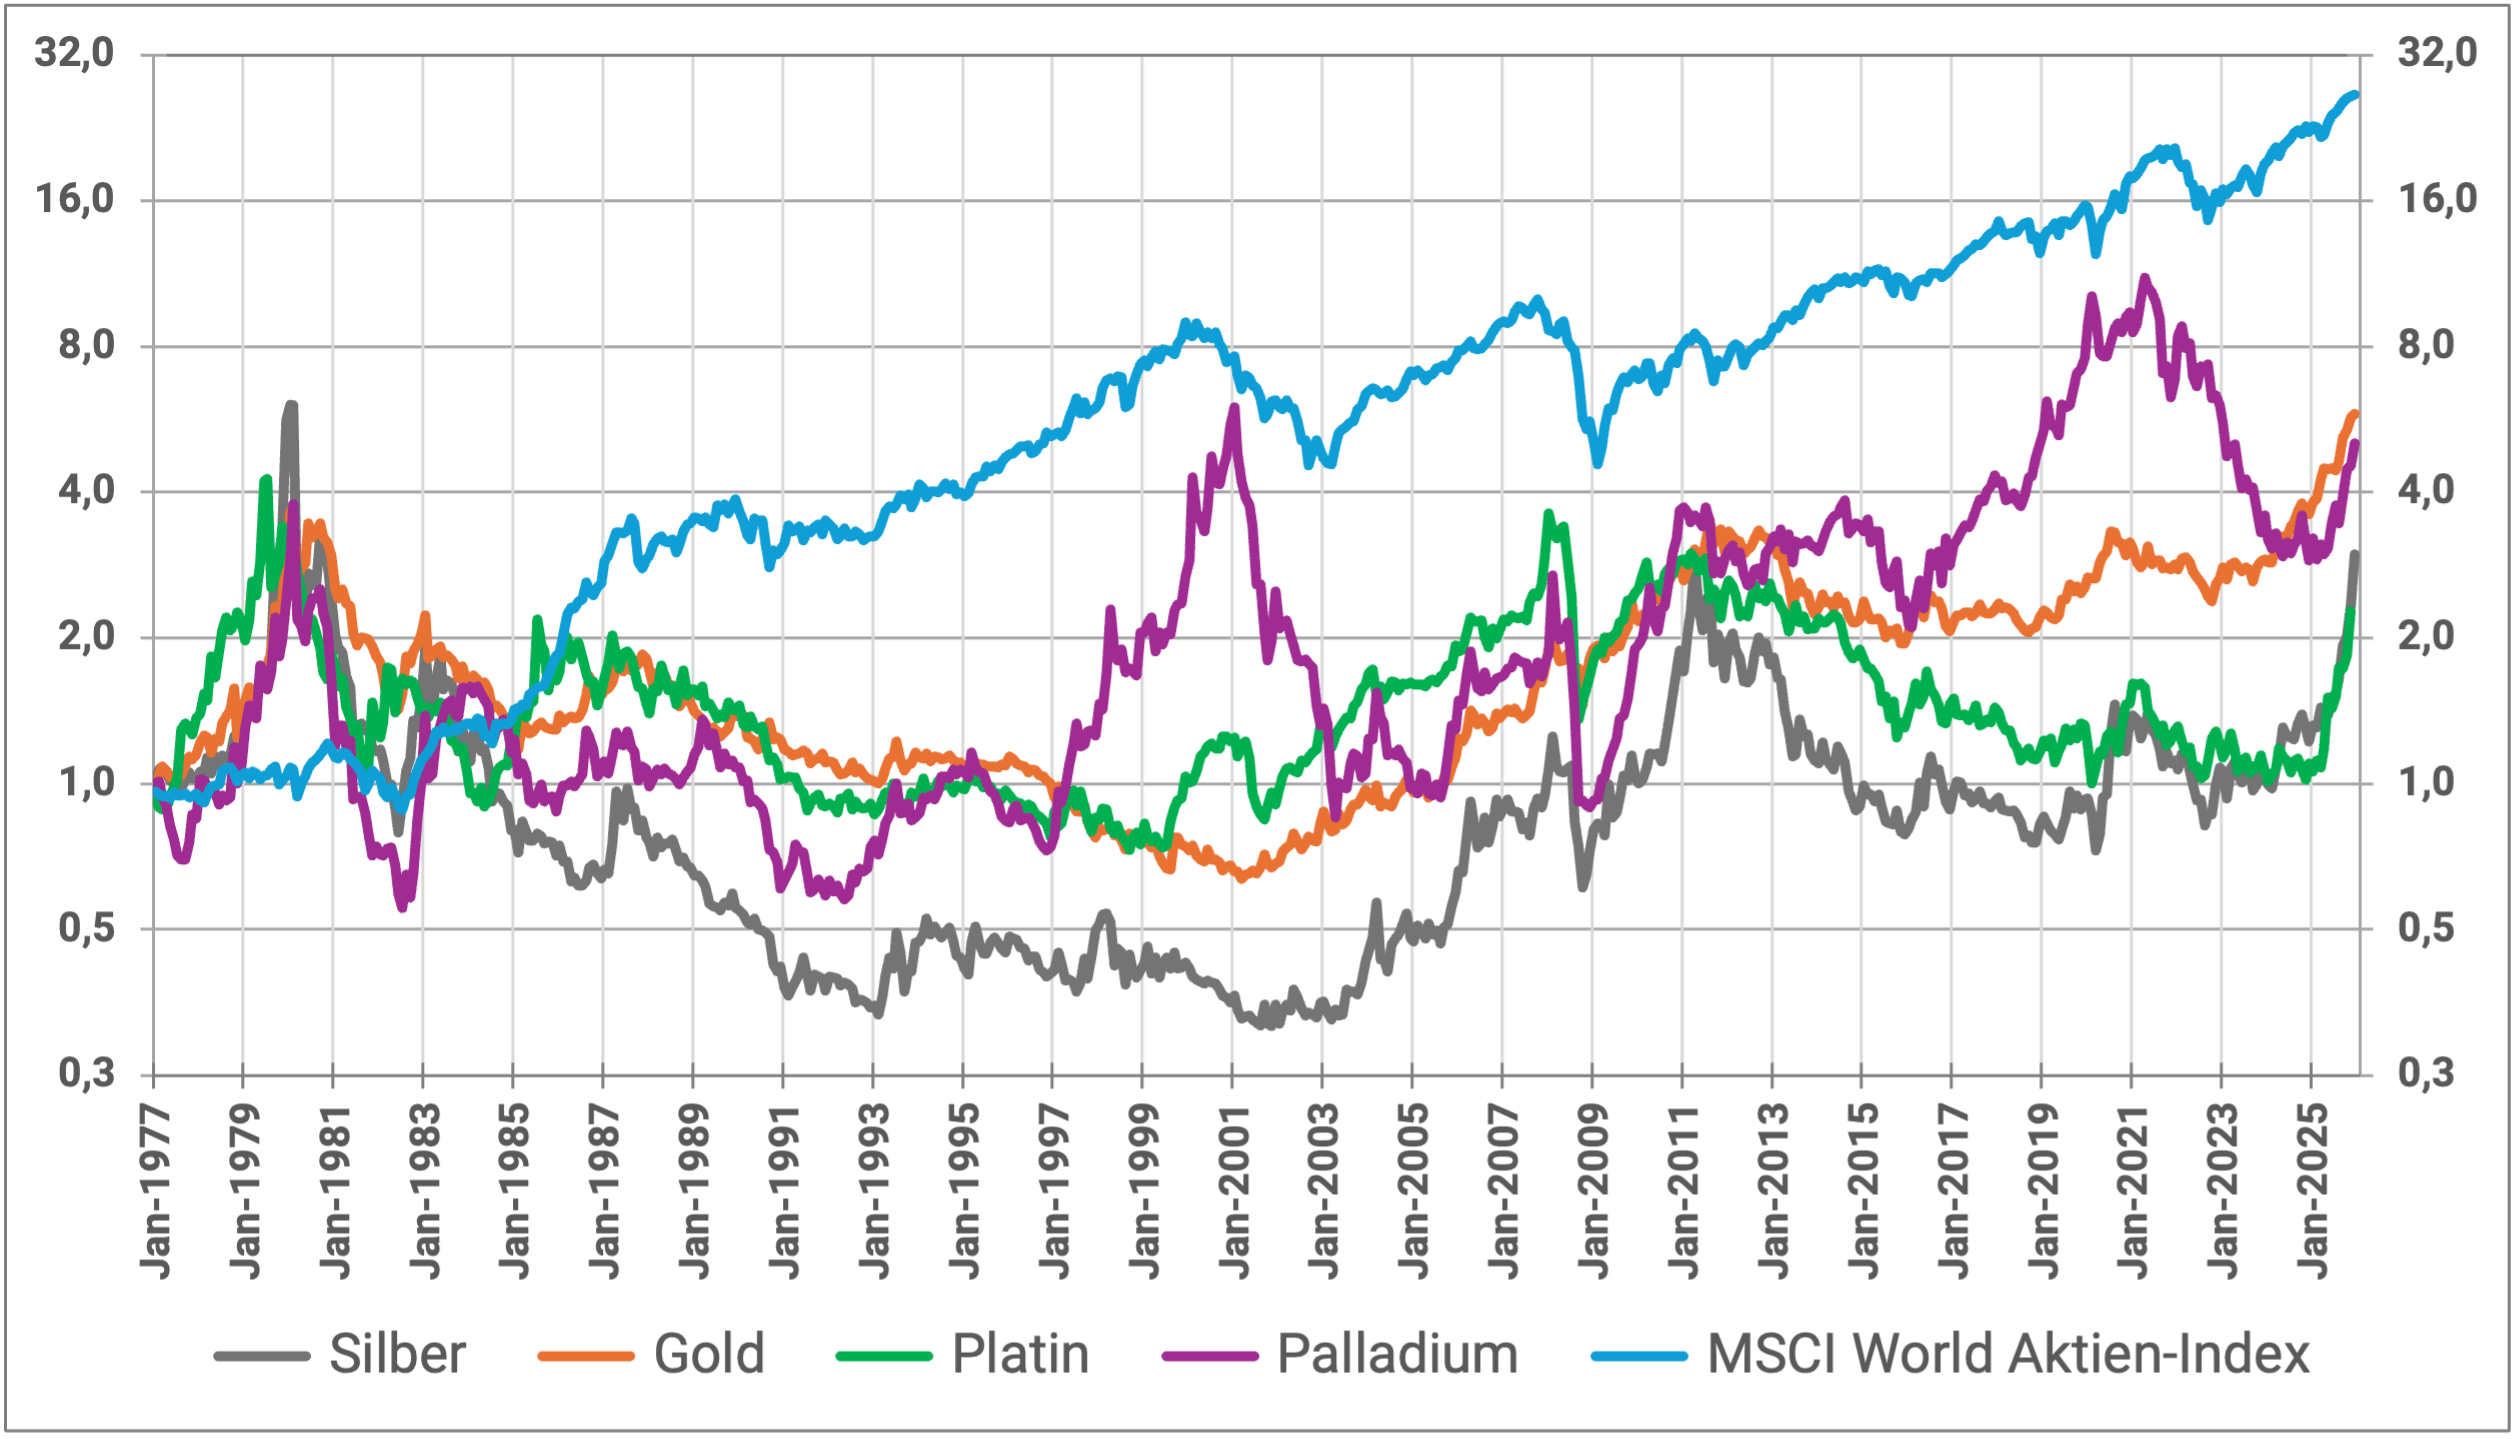
► Data sources: Bloomberg, www.macrotrends.net, Dimensional Fund Advisors. ► Without costs and taxes.
In Figure 1 we use a logarithmic vertical scale. This ensures that a given percentage change in value from one time interval (month, year) to the next appears to the viewer to be the same size across the entire period (horizontal axis), which would not be the case with a linear vertical scale. If the goal is to analyze percentage returns and wealth gains over subperiods of a long overall period, logarithmic plots are less ambiguous.
The two main conclusions from Figure 1 are: Over the entire 49-year period, the MSCI World significantly outperformed the three precious metals. The numerical average returns are listed below in Table 2. The compound interest effect means that an average return advantage of stocks over gold of 3.3 percentage points per annum over these almost five decades results in a drastic final value advantage for stocks over precious metals (26.5 monetary units for stocks versus 6.6 monetary units for gold as the most profitable precious metal).
Risk indicators for the four precious metals in comparison with stocks
In addition, the return development of the stock portfolio was more consistent, both in the short and long term, and less volatile than that of the four precious metals. Table 2 illustrates this with three risk indicators and the risk-weighted return (Sharpe Ratio).
Table 2: Selected performance metrics for the four precious metals and stocks (inflation-adjusted returns in USD)
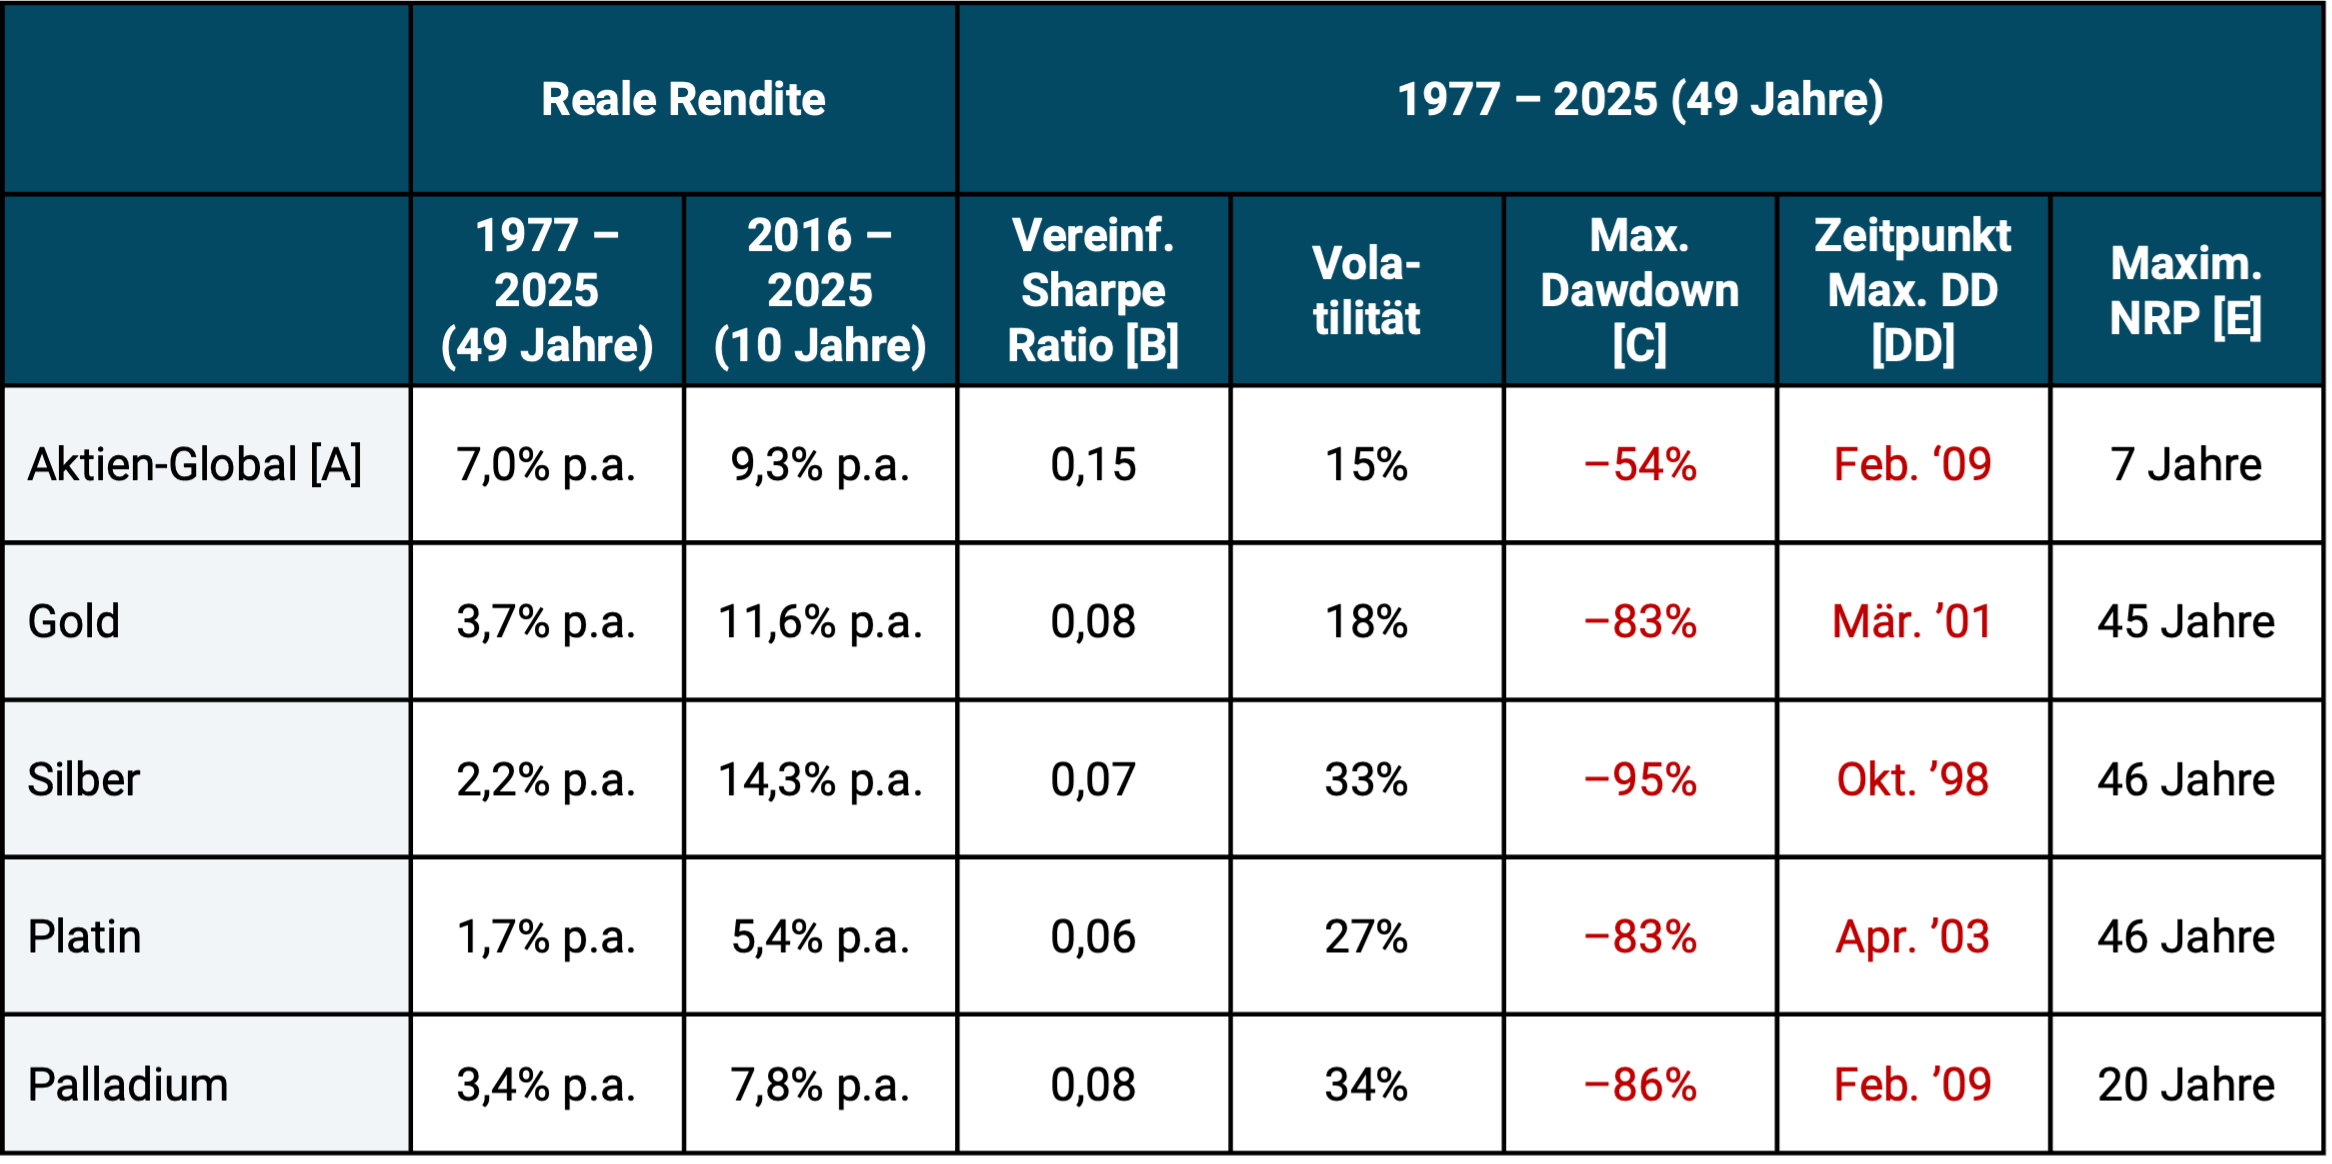
► Stock Global = MSCI World Index. ► [B] Simplified Sharpe Ratio = risk-weighted return (defined as arithmetic Ø return ÷ standard dev). ► [C] Maximum drawdown = maximum cumulative loss in the observation period. ► [D] Maximum drawdown date. ► [E] Maximum zero return period = longest period within these 49 years over which there was a real zero return. ► All data source: See Fig. 1. ► Excluding costs and taxes.
Table 2 provides further interesting insights:
Over the 49-year period, gold has been the best-performing of the four precious metals, but not in the last ten years. If further multi-year sub-periods were shown (which we do not do for reasons of space), the gold return would only be in first place in a minority and in second place or further down in a majority.
In the case of palladium, the relatively high long-term return within the group of four seems remarkable. It was only slightly below that of gold. What stands out about silver is its spectacular returns over the last decade.
In terms of risk, gold tends to rank first (best) among metals. However, the relative risk balance of gold does not appear to be “flawless”: First of all, gold (like the other precious metals) is noticeably riskier than the global equity investment class.
Gold's volatility of returns and maximum drawdown (MDD) are better than those of the other three metals, but at the Maximum Zero Return Period metric [3] Gold performs worse than palladium.
The periods listed in Table 2 for precious metals at the maximum zero return period may seem shockingly long to some observers. However, the numbers are correct. The reason for the high MNRP values is the inflation adjustment of returns combined with the high volatility of precious metal returns. Let's take gold as an example: Gold had an all-time high of $850 per ounce in January 1980, which in today's money (monetary value at the end of 2025), i.e. "inflated", corresponds to around $3,500. However, gold did not actually exceed this price again until August 2024 after 45 agonizingly long years. The situation was similar with the other three precious metals. Only palladium performs noticeably better here with a maximum zero return period of “only” 20 years (1980 to 2000).
Precious metals for diversification in an equity-heavy portfolio
In Table 3 we take a look at the correlations. We want to use them to measure how well the four precious metals are suitable for diversification in an equity-heavy portfolio.
The quality of the inflation can be determined from the correlation with inflation (far right column). Inflation hedging-Derive characteristics of individual investments. [4]
Table 3: Correlation of precious metals with stocks, with inflation and with each other
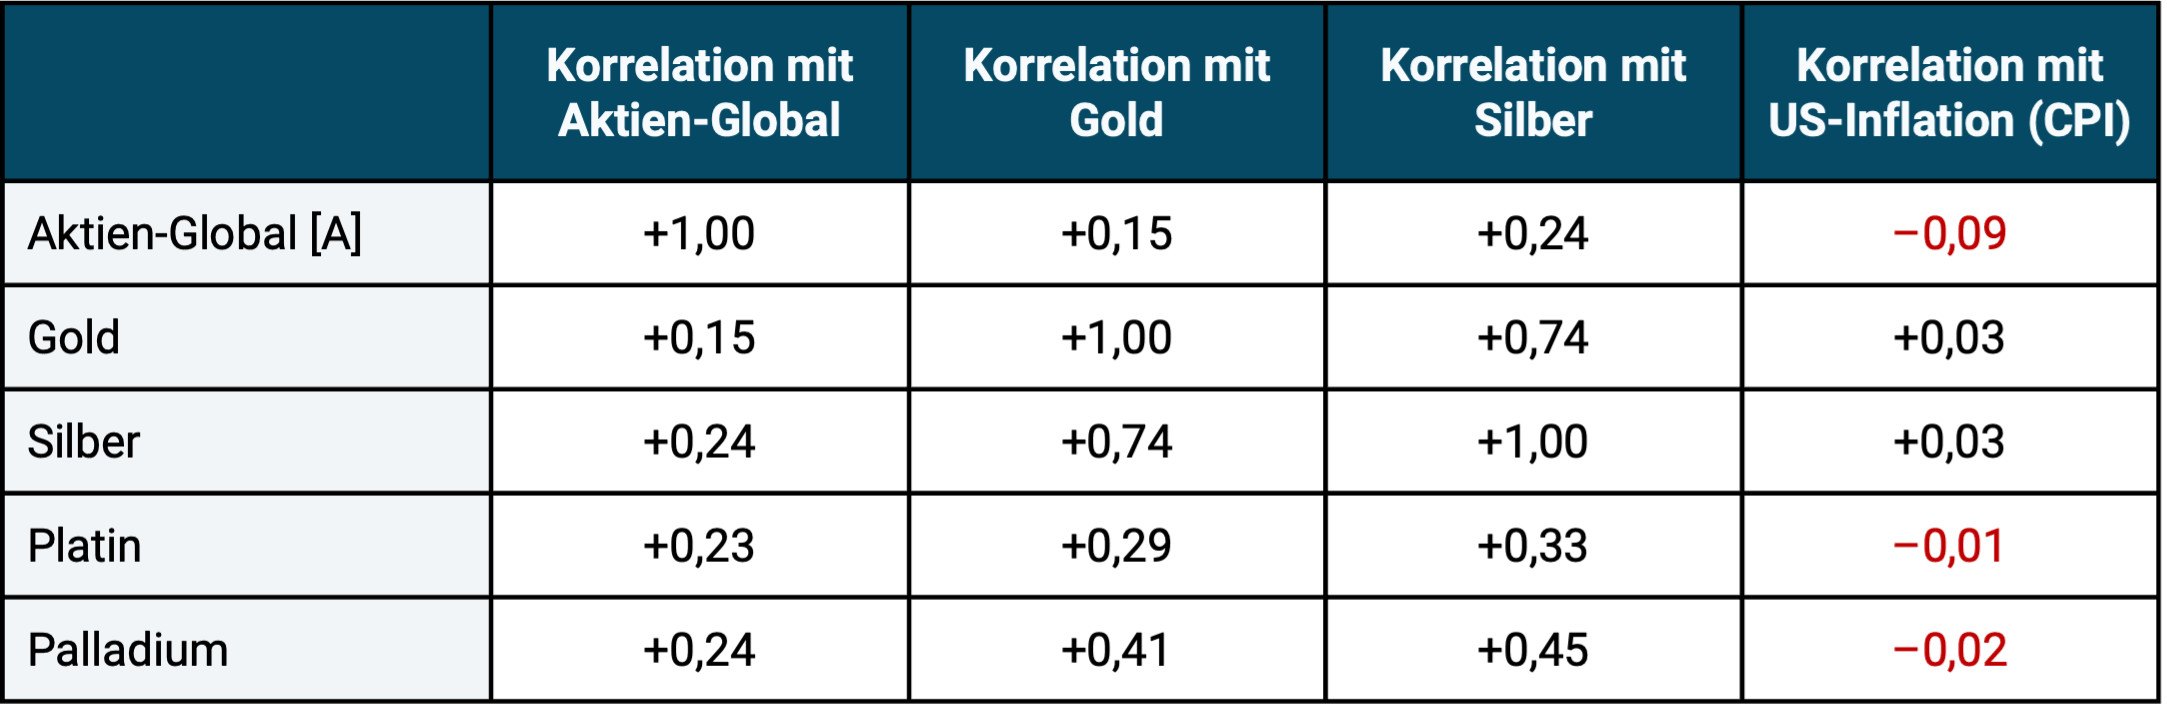
► Global stocks = MSCI World Index. ► Data source: See footnotes to Figure 1.
What insights emerge from Table 3? All precious metals have a low correlation with the equity global asset class. From a pure diversification perspective, all four metals tend to be well suited to reducing the risk (volatility) of a pure stock portfolio. However, to be considered a “good diversifier” you need low correlation and attractive returns.
Platinum and palladium correlate relatively moderately with gold and with silver. Palladium therefore appears suitable for diversifying the risk (volatility) of gold (low correlation with almost the same long-term return). Platinum shows an even lower correlation to gold, but has a weak historical return.
In addition to pure correlation analysis, we also looked at the seven periods between 1977 and 2025 in which the MSCI World Index suffered an inflation-adjusted drawdown of 20% or more [5] and checked which of the four precious metals was the best stock hedge overall in these seven stock market declines, i.e. which fell less than the stock market or perhaps even had positive returns. Even in this diversification test, which is not shown separately using figures, gold performed best among the four metals.
One reason for gold's overall better performance in times of crisis could be that the three other precious metals each have extensive industrial commercial uses. When economies in major industrialized countries weaken (as is often the case during negative stock market returns), their industrial demand also tends to suffer.
The supposed inflation protection of precious metal investments
All four precious metals as well as Equity Global have a correlation close to zero with consumer goods inflation. Therefore, on average over the last 50 years, none of these investments was a good inflation hedge (hedge = protection). The statement that has been heard over and over again in the financial industry, by financial journalists and by finfluencers since time immemorial, that gold and stocks offer “good protection against inflation” is ultimately nonsense. We are not the first in the professional world to notice this. Many believe that an investment that produces a higher nominal return than inflation over the long term therefore offers “inflation protection”. However, this long-term “inflation beating” that every asset class provides is not what scientists understand by “inflation protection” or “inflation hedging”. Inflation hedging and inflation beating are two different things.
In Table 4 we illustrate how well each of the four precious metals performed as an admixture (diversifier) for a global equity portfolio over the period under review.
Table 4: How well do the four precious metals work as diversifiers for an equity-heavy portfolio (inflation-adjusted returns in USD)
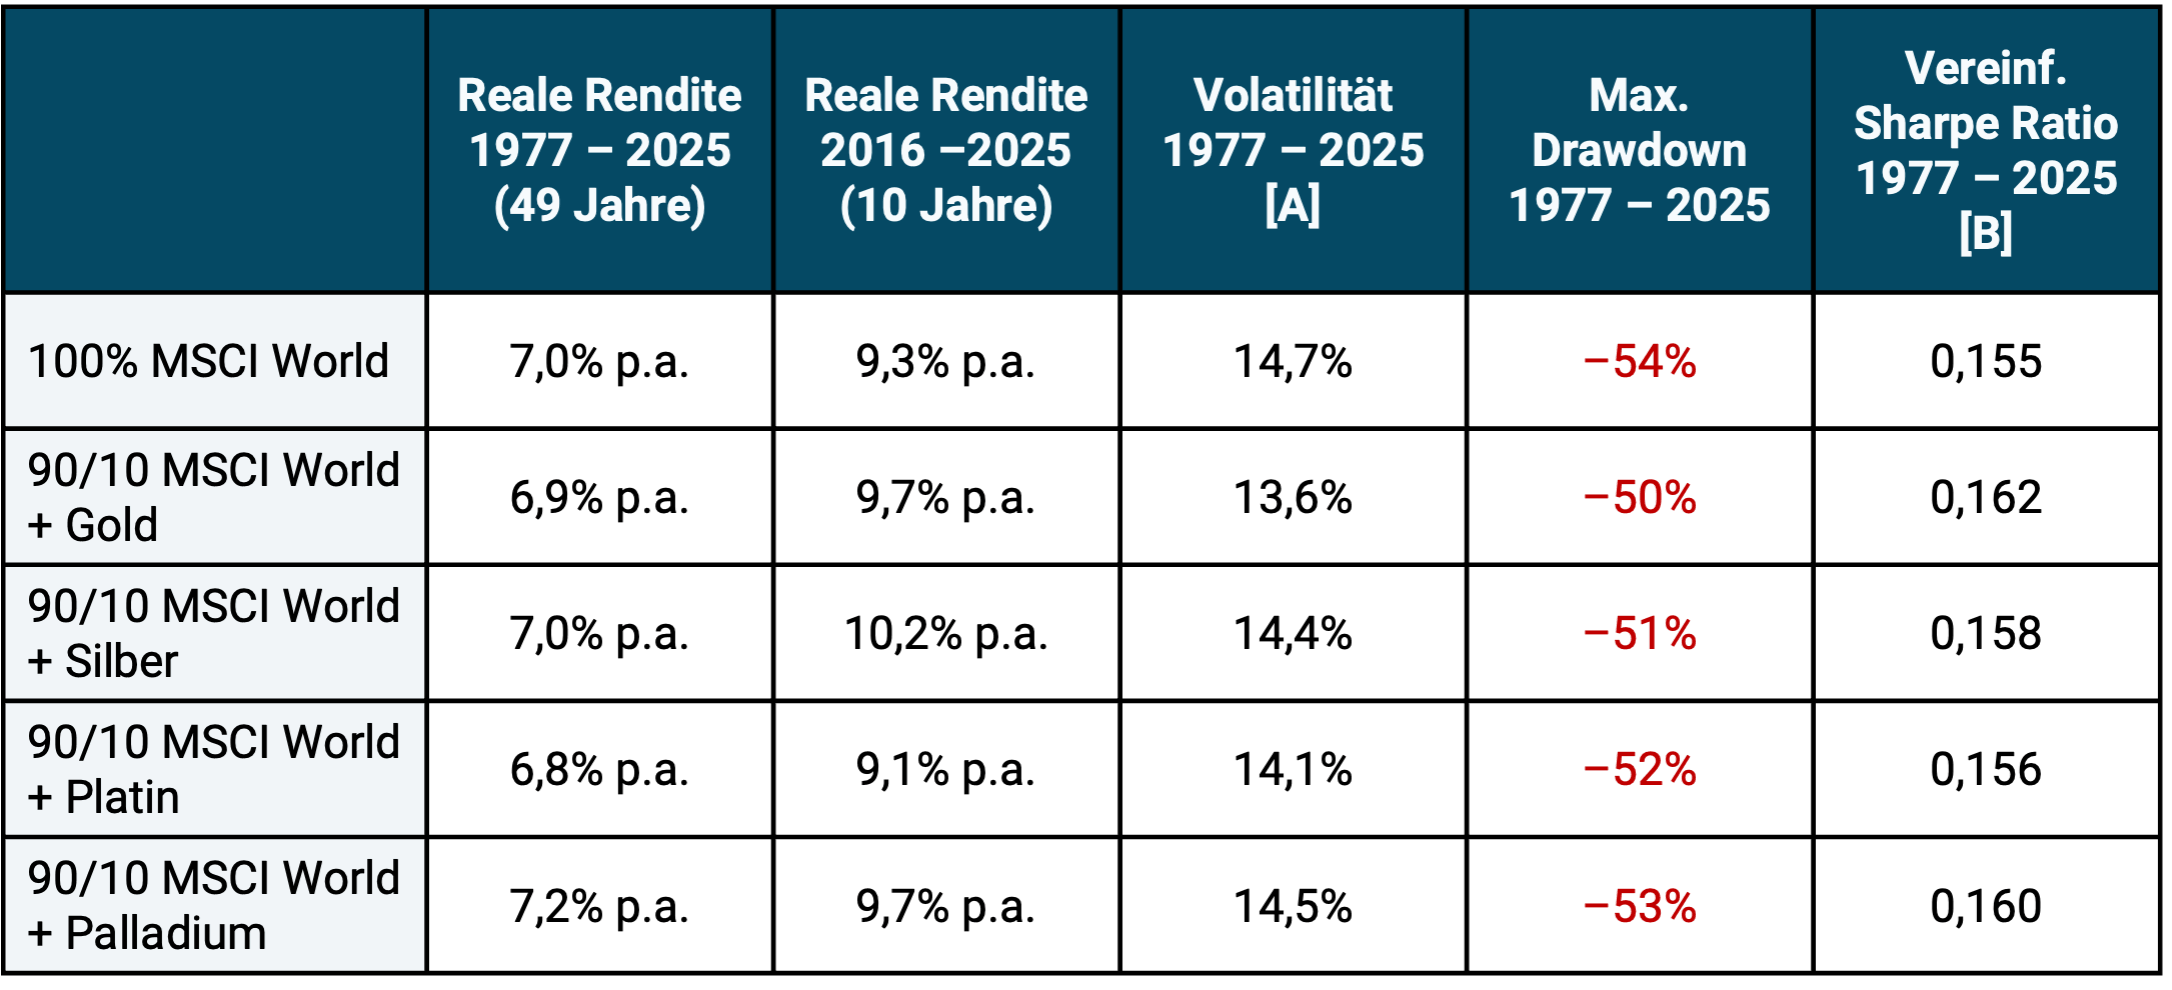
► [A] Vola = annualized standard deviation of monthly returns. ► [B] Simplified Sharpe Ratio: See footnotes to Table 1. ► Data source: See footnotes to Figure 1.
The conclusions from Table 4 are also interesting:
A precious metal admixture of 10% with regular mechanical rebalancing has either slightly improved, left unchanged or only moderately worsened the absolute return relative to a 100% stock portfolio for all four precious metals over the period under review from 1977 to the present. In the last 10 years, the diversifier balance sheet was a little better than in the entire period.
The differences in returns for the entire period in Table 4, which may seem implausible at first glance, are correct, e.g. B. that the 90/10 palladium portfolio has a higher return than the 100% stock portfolio, even though palladium's return individually was quite significantly lower than that of gold. The respective differences between the four 90/10 portfolios are also correct. These effects result from the low correlation of the four precious metals to stocks and probably also from the specific historical return profile over these 49 years. The effect is known in the literature as “diversification return” or “rebalancing premium”. For very low correlated assets and widely varying component weights (here 90% versus 10%), the return of the mixed portfolio can be slightly higher than the return of the larger component. [6]
The additions resulted in slight improvements across the two risk indicators (volatility and maximum drawdown).
In terms of risk-weighted returns (simplified Sharpe ratio), the mixed portfolios also consistently performed slightly better than the 100% equity portfolio.
Although the differences in Table 4 seem rather small at first glance, gold still crosses the finish line as a relatively clear winner in the “Best admixture among the four precious metals” competition for the following reasons:
- When it comes to long-term returns, gold is well ahead of silver and platinum. Only palladium comes close to gold here.
- When it comes to risk, the differences between the four precious metals appear to be rather small. All four also perform similarly in terms of their diversification properties in an equity-heavy portfolio. Only the addition of gold shows slightly lower volatility and a slightly better maximum drawdown.
- Gold's market capitalization is by far the largest, which could potentially be an advantage relative to the three other metals in a truly severe global crisis.
- All four precious metals have tax advantages for private investors in Germany, both as a direct investment and as an ETC (provided the ETC is physically replicating and includes a “delivery claim”). In the case of a direct investment, however, there is only no sales tax on gold. (However, it is uncertain whether the tax exemption for gold according to Section 23 EStG will remain in place in the future.)
- Gold ETCs predominantly have lower ongoing costs (TERs) than ETCs on the three other metals.
For precious metals enthusiasts among retail investors, a palladium ETC could be a worth considering diversifier for a gold investment (replacing part of the gold investment with palladium) based on data from 1977 to today. However, this assumes that the investor is not afraid of the additional complexity that comes with it.
In our analysis, it should not be forgotten that the fundamentally high price volatility for all four metals means that the rather small differences in returns could also have been a coincidence. Given the high volatility, a statistician would complain that gold's return advantage is not “statistically significant”, i.e. not sufficiently reliable. For example, if you were to split the 49 year data into two halves, the picture would look quite different in the two half periods, which is why caution is required when interpreting.
The current valuation level of precious metals
For investment assets that do not generate current income (no current cash flows), such as precious metals, conventional raw materials, collectibles and Bitcoin, the fundamental valuation methods commonly used in economics are not applicable. An alternative valuation indicator for such non-yielding assets is the ratio of their current price to the inflation-adjusted historical average price. We show this rough evaluation indicator in Table 5.
By this standard, two of the four precious metals are expensive today, namely gold and silver. One thing is very cheap: platinum. Palladium is moving relatively marginally above its historical average real price. Looking forward, high valuations tend to lead to lower future returns.
Table 5: The current valuation level of the four precious metals – multiple of the inflation-adjusted average price since 1977 (in USD)
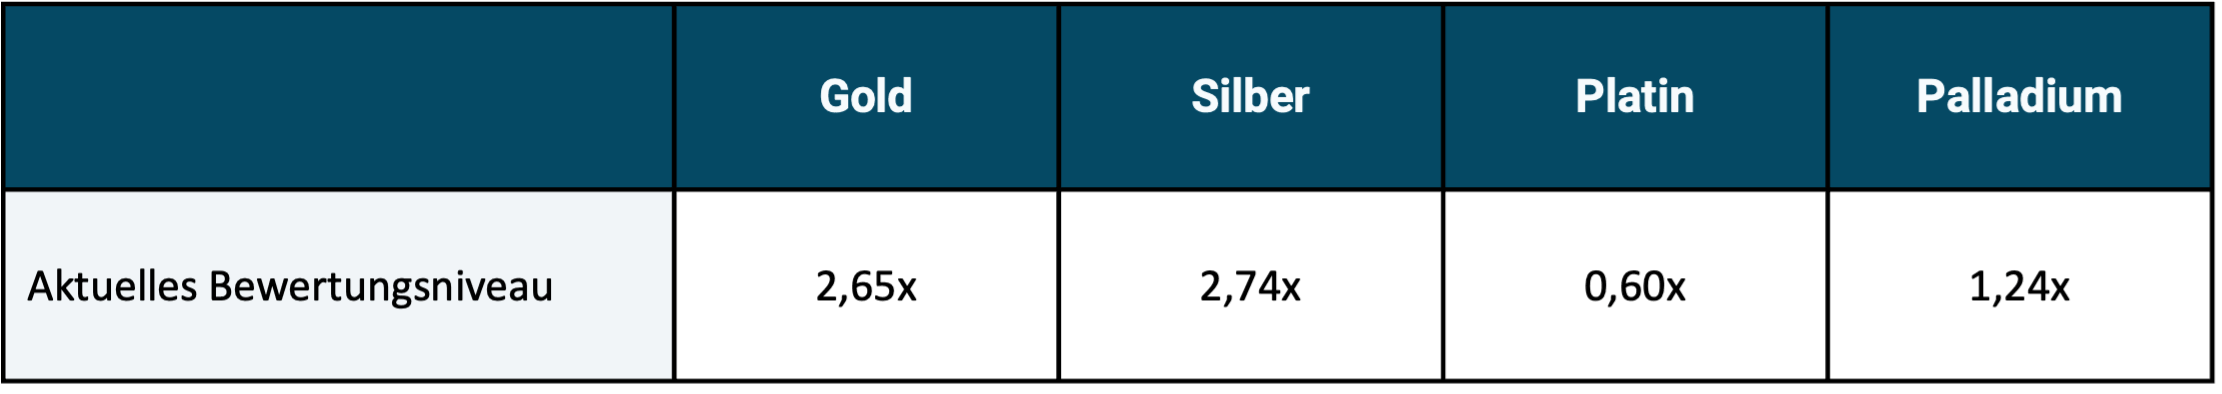
► “Current valuation level”: Ratio of the price for one troy ounce on January 31, 2026 relative to the average inflation-adjusted (“inflated”) price since January 1977. Reading example: On January 31, 2026, the gold price was 165% above its inflation-adjusted historical average since 1977. ► Data sources: See footnotes to Figure 1.
Naturally, such considerations (taking into account the current valuation level) are irrelevant for anyone who believes that they can predict the price development of these precious metals in the relevant future with sufficient reliability or for someone who believes that due to future economic or political developments, the already very high prices of gold and silver will continue to rise sharply. We consider such a forecast claim to be unrealistic and, if implemented in the form of market timing, ultimately detrimental to returns. We also do not believe that the high returns of gold and silver over the past 15 years will be achieved on average over the next 15 years.
Reasons for the high price increases of gold in the recent past
For gold, the very high price increases in recent years are usually justified by high and rising national debt ratios, extensive gold purchases by central banks (because they are reducing dollar bonds in their reserves and partially replacing them with gold) as well as a “new distrust” of a growing part of the population in “the elites” and the “FIAT monetary system” (this distrust is expressed with gold purchases). However, even if this is a correct identification of the main price-driving factors, the information and knowledge about these factors are probably already priced in today. From our point of view, how they will develop in the short and medium-term future and thus how the gold price will develop in the short and medium term is unknown today.
The fact that the current weakness of the dollar should be a relevant advantage for the returns of gold and other precious metals is a common misconception that we here (see “Question 9”) and here refute.
Conclusion
None of the four precious metals examined here have historically had long-term returns as high as stocks.
Of the four precious metals, gold was the most profitable in the roughly 50 years from 1977 to 2025. When it comes to long-term returns, palladium – which may come as a surprise – came in a close second.
Gold and silver currently appear to be highly valued, i.e. expensive, while platinum is cheap and palladium is close to the average price. From a statistical perspective, a high rating reduces the forward trend expected return relative to the high returns of recent years.
Overall, gold was the lowest-risk precious metal during the period under review. It also has the lowest correlation to the global stock market and was the best stock diversifier overall in the seven strong stock market down periods since 1977.
For private investors, there is a sales tax disadvantage relative to gold in the case of direct investments (not in ETCs) for silver, platinum and palladium.
Gold also performs best on balance among the four precious metals when it comes to the additional costs of investing.
So gold goes in the competition “who is the (relatively) best admixture?” clearly emerged as the winner. In our opinion, second place is not silver, as some might have expected, but palladium.
In the long term, a gold admixture is unlikely to increase the return relative to “100% stocks” and may even lower it somewhat, but it can moderately improve the risk profile of the overall portfolio.
Anyone who looks at precious metals individually, i.e. not at the aggregated effects in an overall portfolio with a precious metal admixture, must be able to cope with their high drawdowns and extremely long periods of zero returns as an investor. This is only likely to work long-term for most private investors - i.e. not result in harmful panic selling - if the percentage of (all) precious metals in their total asset portfolio is relatively low - e.g. B. a maximum of 10 percent.
Endnotes
[1] See German Wikipedia, article “Precious metals”. In addition to the four metals shown here, the following are among the 15 precious and semi-precious metals: iridium, osmium, mercury, polonium, rhodium, ruthenium, bismuth, technetium, rhenium, antimony and copper.
[2] The ban on private households owning gold existed for several decades in many capitalist and communist countries in the 20th century. A violation was usually punished with harsh and, in some states, draconian penalties. See article “Gold ban” in the German Wikipedia.
[3] Maximum NRP = Longest period within these 49 years in which there was a real zero return.
[4] A brief explanation of the “correlation” metric can be found at the end of this blog post.
[5] These include the crashes in October 1987, the dot-com crash (beginning of the noughties), the Great Financial Crisis (from 2007), the Covid crash (2020), the Ukraine war and interest rate change crash (2022).
[6] See e.g. B. Hallerbach, Winfried (2016): “Disentangling Rebalancing Return”, December 10th. 2016, Internet reference: Social Sciences Research Network/SSRN.
Infobox: Correlation – a quick explanation
Correlation is a key figure from statistics that measures the degree of parallelism in the development of two variables (series of numbers), for example the price changes of two securities or two asset classes over time. Correlation is measured in the form of the correlation coefficient, which ranges between +1.0 and -1.0, where +1 stands for complete correlation (exact parallel development), 0 for completely independent (or random) development and -1 for exactly opposite development. The lower the correlation between two financial assets, the more suitable they are for diversification in a portfolio, all other things being equal. Just like returns, correlations also fluctuate over time, but to a lesser extent.