
From Daniel Ganowski and Gerd Kommer
Renowned American financial market researcher William Bernstein has the stock market quip “If you are a twenty-something, just beginning to save, then get down on your knees and pray for a market crash.”
If you consider how hysterically and alarmist the financial industry, the media and most Internet bloggers warn us every week about the dangers of a stock market collapse, then Bernstein's statement appears bizarre and dubious.
In this blog post we calculate whether Bernstein is right with his curious statement.
One clarification first: that one more not at all invested investor benefits purely mathematically from a stock market collapse, that's not what this blog post is about. It's about investors who have already invested.
We would like to anticipate the main result of our calculations: Yes, Bernstein is right. It can be shown quantitatively that a stock market crash favors young investors under realistic conditions, provided investors do it right. This correct procedure is neither complex nor does it require access to special information, especially not to pseudo-knowledge “Crash Prophets”. What it requires is discipline and a little wise humility.
You can even go one step further: to benefit financially from a crash, you don't even have to be younger than 30, as the Bernstein quote suggests. The crash-taking advantage also exists for older investors.
We will explain the factual background to this and the numerical effects in this blog post.
We begin with a description of the assumptions underlying our computational test of Bernstein's “wishing to crash thesis.”
We assume an investment period of 35 years. To put it bluntly, this is “an investor’s life” or “an investor generation”. During this investor's lifetime, the investment used here in the form of the global stock market produces a return of 8.0% p.a. This value corresponds approximately to the actual nominal return of the MSCI World index in the 35 years from 1986 to 2020 - in euros, before costs and taxes. With an index fund on a buy-and-hold basis, a private investor could have earned 8% annually over these three and a half decades. (For the sake of simplicity, we do not take costs and taxes into account because this waiver is irrelevant to the basic result.)
We further assume that a hypothetical investor, whom we will call Hanna, in these 35 years a have to experience a severe stock market decline of minus 60% in a single year. With the value of minus 60%, we are deliberately going beyond the extent of most of the severe stock market declines in the last 120 years. (If we had spread this 60% drop over two or three years, it would not fundamentally change the results presented below.)
Over the entire 35-year period, we assume an average return in the market of - as mentioned - 8% p.a. The complete market recovery after the crash is assumed to take four years. This assumption is probably realistic. If you look at the ten worst global stock market declines in the past 120 years, four years is likely to be approximately the average length of the recovery phase. We will also show below what influence a slower (longer) recovery phase would have.
Logically, the average return over the four years of recovery must be noticeably above 8.0% so that we can reach the average of 8.0% p.a. over the entire 35 years. A numerical example to illustrate this: After a crash of 60%, the “recovery return” must average 38.4% p.a. over the following four years in order to achieve an average return of 8.0% over the entire five years. In all non-crash and non-recovery years, the annual return is assumed to be constant at 8.0%.
Hanna invests 1,000 euros per year in the first of the 35 years. This annual savings amount increases uniformly by 4.0% p.a. over the following 34 years, rising to 1,040 euros in the second year. Why 4.0%? Because we assume that Hanna's income will also increase by 4.0% annually over these 35 years. This assumption is not all that arbitrary. In the 50 years from 1971 to 2020, nominal net hourly wages in Germany grew by around this percentage. In real life, Hanna could probably increase her savings rate beyond her percentage increase in income and still her standard of living would increase from year to year. However, the specific rate of increase in your annual savings amount has no influence on the basic result of our simulation.
Now we examine what influence the exact timing of our assumed 60% crash has on Hanna's final wealth. We are particularly interested in how an early versus a late crash within 35 years affects the final wealth achieved. After all, in his statement, Bernstein placed the emphasis on the wish for a crash “now” by young investors who, by definition, still have a long investment phase ahead of them.
Table 1: Illustration of the impact of the timing of a single 60% crash at different times within a total period of 35 years with a subsequent recovery period of four years and reference scenario without a crash
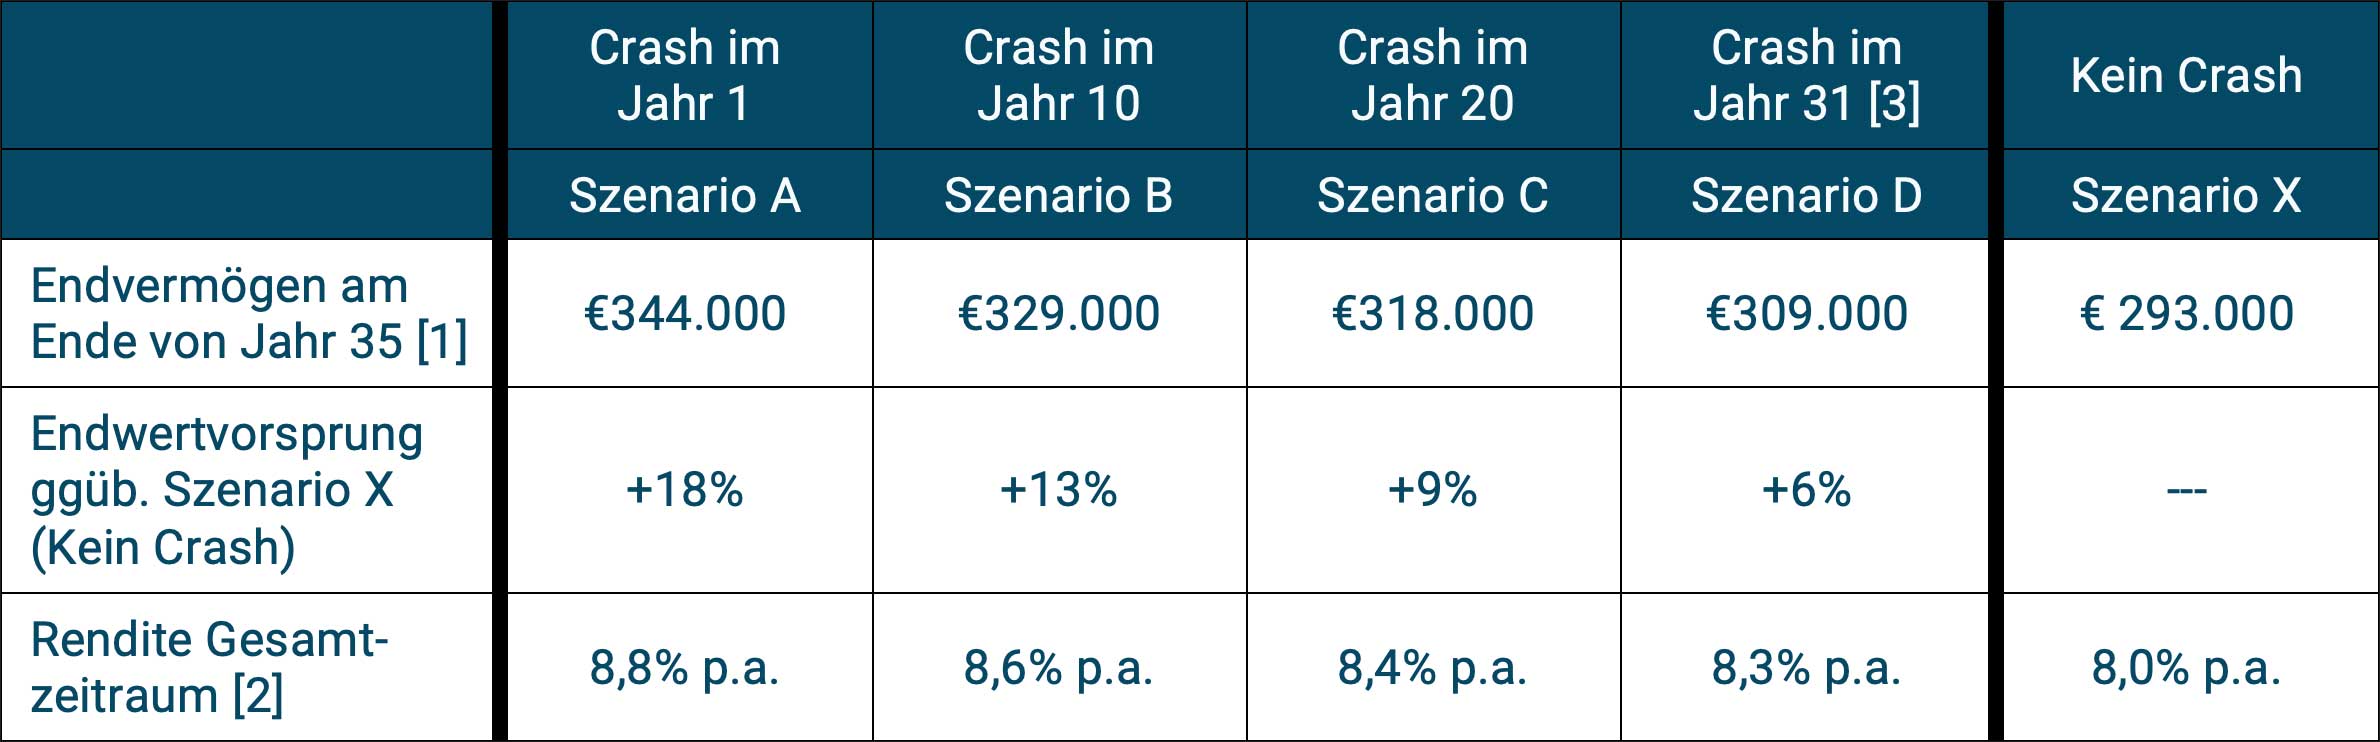
► All numbers rounded. ► [1] The total deposits over the 35 years amount to almost 74,000 euros. ► [2] Return measured as the internal rate of return of all deposits and the final asset value. ► [3] Year 31 is the latest year in which a full recovery can still take place over, by definition, four years - see the assumptions formulated in the following text.
What are the main conclusions from the calculations summarized in Table 1?
In all four crash scenarios shown here, including the two scenarios with a crash in the second half of the 35 years, the final assets and thus also the average return over the entire 35-year period are higher than in the reference scenario without a crash (scenario X in the far right column). Some readers will rub their eyes and ask, "How is that possible? Shouldn't final assets and returns in the event of a crash be worse than without a crash?" Or: “Can’t the return at best be the same as in the non-crash scenario?”
The explanation for this counter-intuitive result lies in the so-called “sequence of returns risk”.
First, a little theory: When calculating the final asset value of a one-time, initial investment (as well as the average return) over a total period of, for example, 10, 20 or 35 years, the order of the individual annual returns does not play any role. This means that you can swap the positive and negative annual returns in the individual years within the overall period as you wish - the result is always the same average return and the same final asset value. The “law of substitution” that we learned about in math class applies (applicable to multiplication and addition, but not to division and subtraction). With a one-off, initial investment, there is no risk of return sequence.
The situation is different in a portfolio in which there are inflows or withdrawals over time - as in the case of Hanna and as in the case of probably 95% of all private investor households over a sufficiently long period of time and almost certainly over a 35-year period. As soon as significant inflows or withdrawals (cash inflows or cash outflows) take place, the law of exchange for the annual returns no longer applies. For a given annual average return over the entire period, expressed mathematically as an arithmetic or geometric average, the specific order of individual annual returns has a large influence on the level of final wealth and the average return in terms of the investor's internal rate of return (the internal rate of return is generally the most meaningful return measure). It therefore plays a role when exactly the good and bad return years occur within the overall period and how much money was invested at the respective time.
As a rule of thumb you can say:
(a) For a portfolio that is experiencing inflows (a portfolio in the wealth creation phase, like Hanna), the bad annual returns should ideally occur at the beginning and the good ones at the end. Main reason: There isn't that much money invested at the beginning (more on that below).
(b) For a portfolio in the withdrawal phase (the use or consumption of assets), the poor annual returns should ideally occur at the end and the good ones at the beginning. Reason: A lot of money is invested at the beginning, but less at the end due to the withdrawals.
Back to Hanna's portfolio: In scenario A (crash in year 1), the final assets are higher than in scenario The overall higher annual returns (which later compensate for the minus 60% annual return) have an impact on higher periodically invested cash inflows (savings), because Hanna's annual savings increases over time. Furthermore, the earlier the crash occurs, the more time the higher returns after the crash occur on average, the more time they have to impact the assets already invested. In this way, the compound interest effect can do its good work better.
And what is as surprising as it is pleasing is that this effect leads to higher final wealth even if the crash occurs quite late, in extreme cases only in the year 31. Bernstein understates the positive effect of a crash for portfolios in the asset accumulation phase when he says that this benefit only applies to young investors with a long remaining investment horizon.
So one can conclude that almost all households in the portfolio construction phase should pray for an imminent crash, not just the young ones. Provided that the investors in question are in the portfolio construction phase (as defined here) and provided that there are still at least four or five years until withdrawals from the portfolio take place for the first time.
However, if the crash in Hanna's world were to take place in year 32 (of 35 years) or even later and therefore no complete recovery could take place in the four years we have specified up to the measurement time at the end of year 35, then the final asset value and the internal rate of return would of course be below the values for scenario X (no crash), and the later the crash occurs, the more so. However, even with a 60% drop in the very last year (year 35), the internal rate of return would still be 2.6% p.a. This is very likely above what a savings account investor would have achieved in these 35 years without a crash. (However, the savings account investor would have had almost no volatility.)
Our calculations revealed another interesting result:
If one assumes that the post-crash recovery phase does not last four years, as in our first simulation described above, but longer, then the positive final wealth effect of a crash becomes even stronger. Some numbers to illustrate:
We repeat the calculations described above for Klara. In her world everything is the same as with Hanna, with the one exception that Klara's post-crash recovery does not take four years, but rather an agonizingly long seven years.
Table 2: Illustration of the impact of the timing of a single 60% crash at different times within a total period of 35 years with a subsequent recovery period of seven years and reference scenario without a crash
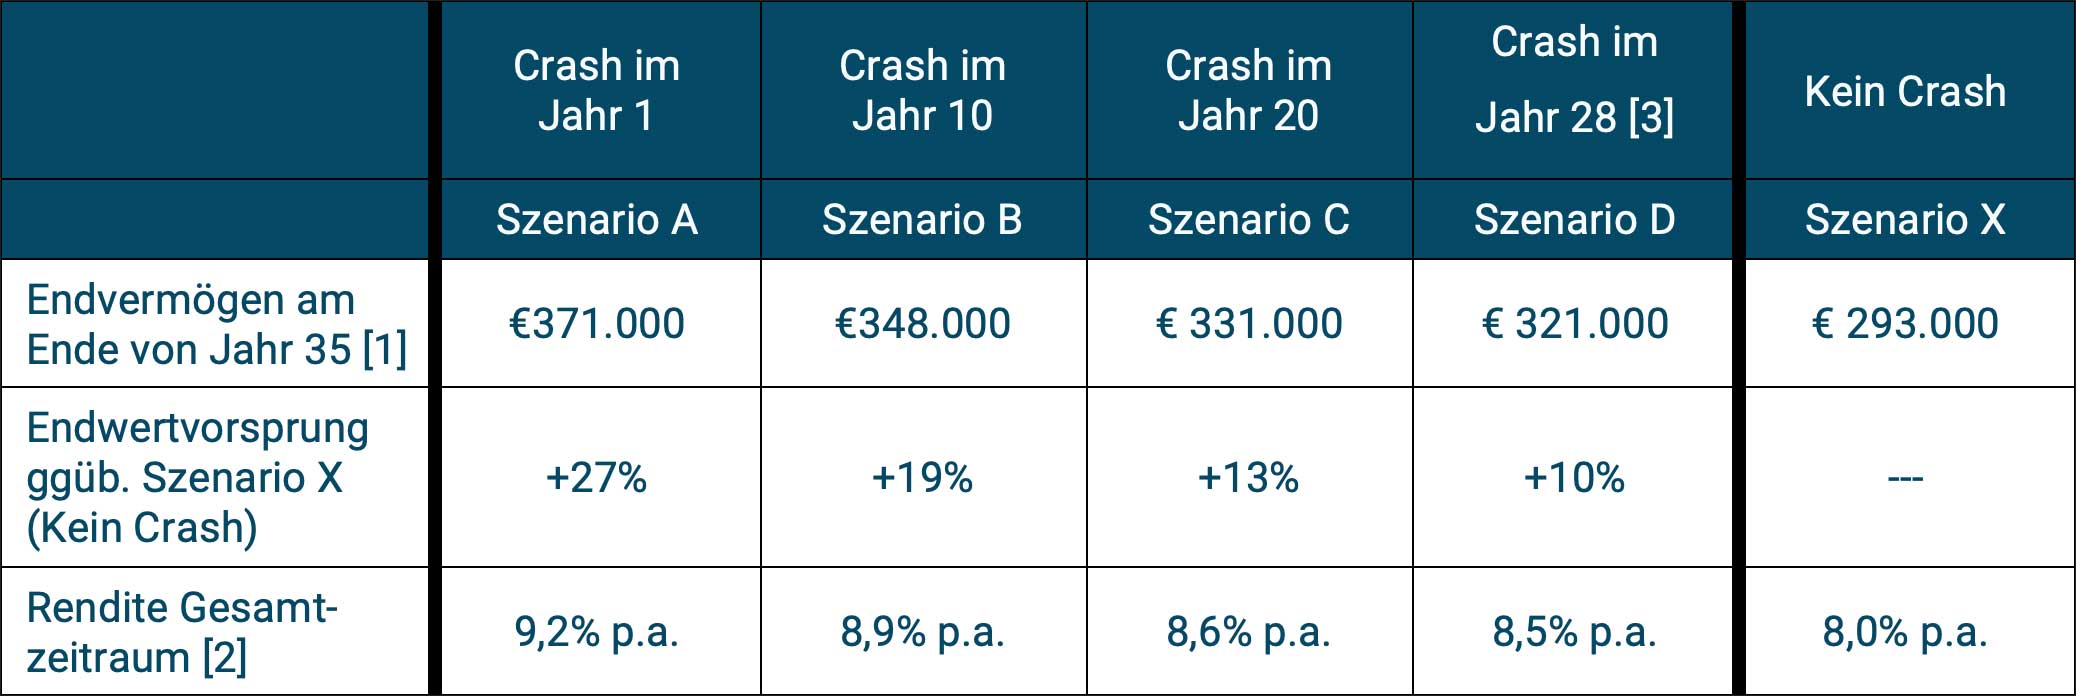
► All numbers rounded. ► [1] The total deposits over the 35 years amount to almost 74,000 euros. ► [2] Return measured as the internal rate of return of all deposits and the final value of assets. ► [3] Year 28 is the latest year in which a full recovery can still take place over, by definition, seven years - see the assumptions formulated in the current text.
Our modified calculation with slower recovery after the crash leads to even better results in Table 2 for scenarios A to D than in the Hanna world (Table 1). This is remarkable in that many self-proclaimed experts not only warn of a crash of a certain magnitude and ultimately portray it as the most terrible of all investment evils, but also that the recovery could take a particularly long time - not just around four and a half years like after the Great Financial Crisis (which began at the end of 2007) or less than a year like in the Corona crash (which began in mid-February 2020).
What we don't show here in a separate table: All other things being equal, a stronger crash has one more advantageous Impact on the final asset value than a weaker crash. This can also be interpreted as good news.
Conclusion
William Bernstein is right. Investors in the wealth creation phase - not just "young" investors in the wealth creation phase - should ask their creator for a crash that is as severe as possible as soon as possible, followed by a particularly slow recovery phase. This crash will benefit them financially. The earlier the crash occurs, the greater the financial advantage relative to a non-crash scenario.
However, everything that has been presented here only applies to passive investors with a globally diversified stock portfolio on a buy-and-hold basis in the portfolio and asset creation phase. Such investors can be absolutely sure that their portfolio will bounce back after any crash and sooner or later exceed the pre-crash level.
Two further important prerequisites for the validity and applicability of the insights formulated here are that, in a crash that could start “tomorrow”, the investor firstly has at least five years before funds are withdrawn from the portfolio. Secondly, investors must continue their regular savings in a planned and disciplined manner during a crash - when the depressing negative monthly and annual returns appear - and ideally even increase them, even if this painful downturn lasts far longer than a year. If he does “rebalancing” in favor of the equity portion of the portfolio during a crash, that will benefit him statistically.
The statements made in this blog post expressly do not apply to the following investor groups and investor situations:
- to all investors in the asset consumption phase, i.e. investors who are already withdrawing funds from the portfolio or investors who will start doing so in a few years;
- on “experts” who believe they can reliably predict the timing, extent and duration of a crash.
- to active investors or their financial service providers, regardless of whether they are in the asset accumulation or asset consumption phase. Active investors are stock pickers (individual security investors) or market timers (someone who engages in tactical “in/out”). Active investors believe they can predict security prices or asset class returns with sufficient reliability in the short and medium term. We don't believe that about ourselves.
We also addressed the question of whether “now” is the right time to enter the stock market in three previous blog posts - each from a different data-based, forecast-free perspective. Readers who would like to find out more about what we believe to be an exciting topic are referred to our following blog posts:
— Why “crash timing” (waiting for a crash and only entering the market afterwards) is, on balance, detrimental to returns: Blog post from March 2019.
— Should you invest a large amount of money slowly in the stock market in several tranches over a longer period of time or should you better enter completely all at once: Blog post from July 2020.
— Why reaching an all-time high in the stock market is misinterpreted as a warning signal for “better wait and be careful now”: Blog post from February 2021.