

From Alexander Weis and Daniel Chancellor
A good year ago no one wanted to believe it, but now it has happened: interest rates have risen significantly. In absolute terms, interest rates are still low from a historical perspective, but relative to the low point in mid-2021, they have risen almost dramatically in most countries. In Germany they rose by just over one percentage point and in the USA they rose even more significantly. [1]
Rising interest rates tend to have a negative impact on most asset classes in the short term, but are particularly negative on medium and long-term bonds.
For retail investors who have a portion of their portfolio invested in bonds – including individual bonds, bond ETFs and actively managed bond funds – this raises the question of what implications rising interest rates will have on their bonds specifically and how they should deal with them. In this article we answer these questions using specific bond ETFs as an example.
Bonds and Interest – a refresher
To start with, a quick refresher on bond theory and bond mathematics: The risk of bonds can be broken down into currency, creditworthiness and term risk. Since we want to focus on the effect of interest rate changes, we have chosen ETFs whose underlying indices have no currency risk and the lowest possible credit risk, so that the term risk - which is often also referred to as interest rate change risk - is decisive for the expected return of the products under consideration.
In this context, it is important to first understand that there is a negative relationship between changes in general interest rates and bond yields. All other things being equal, when interest rates fall, bond prices rise and when interest rates rise, bond prices fall. If you would like to better understand this mechanism, which is fundamental for bond investors and its importance can hardly be overestimated, we recommend our blog post “The interest rate risk on bonds“ from December 2019.
Furthermore, as an investor in interest-bearing investments, you should be aware that there is no such thing as “the” interest rate, but that you would actually always have to say which interest rate or which interest rate market you are talking about when you talk about changes in interest rates or market interest rates. An increase in interest rates on one-year German government bonds by one percentage point does not necessarily mean the same increase in ten-year German government bonds - this is referred to as changes in the so-called yield curve.
The situation is similar with the interest rates of different countries or currency areas: if interest rates rise in Great Britain, for example, there does not necessarily have to be an increase in interest rates in this country, although interest rate changes in open economies such as the USA tend to be accompanied by similar changes in other open economies with a more or less long time lag due to economic interrelationships.
The market interest rates for bond issuers with different credit ratings (example: German companies with a medium credit rating compared to the more creditworthy German government) are of course not identical within one currency and with the same remaining term. Anyone who is interested in the economic background to this can do so here and here read up.
In order to keep our following case study as simple as possible and easy to understand, we assume for simplicity that our “market interest rate” corresponds to the interest rate for ten-year German government bonds. As mentioned at the beginning, the nominal market interest rate according to this definition was around -0.2% p.a. at the end of April 2021. a. and at the end of April 2022 it was around +0.8% p.a. a. – an increase of one percentage point. (This is a good thing in that from a didactic perspective, a change of exactly one percentage point can easily be expected.)
Behind this is the economic concept Modified Duration, which is used to measure the expected influence of interest rate changes on bond prices, other things being equal (“ceteris paribus”). The modified duration (often simply called duration for short) indicates how much the price of a bond falls if the corresponding market interest rate rises by one percentage point and vice versa: If market interest rates rise by Z%, the market price of a bond falls by Z × D%, where Z corresponds to the increase in interest rates in percentage points and D corresponds to the duration of the bond (or the bond portfolio). An example: Interest rates rise “overnight” by half a percentage point from 1.0% to 1.5% and the duration of a bond is 5 years. In such a case, the price of the bond will fall by approximately 0.5% × 5 = 2.5%. However, if interest rates had fallen from 1.0% to 0.0%, the price of our fictitious bond would have increased by 5.0%.
For bonds with low coupon payments, the duration is approximately equal to the remaining life in years; For bond portfolios with high coupon payments, the duration is significantly below the average remaining term of the bonds in question. The duration of an ETF can usually be found in the fund company's fact sheet.
So much for the – unfortunately somewhat dry – theory. But now it’s back to practice.
ETFs in our comparison
In our mini case study below, we limit ourselves to the following three ETFs (or indices that are tracked by these ETFs):
- iShares eb.rexx® Government Germany 1.5-2.5yr UCITS ETF (ISIN: DE0006289473)
- iShares eb.rexx® Government Germany 2.5-5.5yr UCITS ETF (ISIN: DE0006289481)
- iShares eb.rexx® Government Germany 5.5-10.5yr UCITS ETF (ISIN: DE0006289499)
These ETFs track German government bonds (more precisely, a basket of government bonds) with different average remaining maturities. [2] The underlying index series “eb.rexx® Government Germany” is well suited for our purposes because the different remaining terms are available as ETFs (the eb.rexx® indices are created by a subsidiary of Deutsche Börse AG, which also calculates the DAX).
The return on bonds in a particular currency is essentially determined by three factors:
(a) term,
(b) Creditworthiness (creditworthiness)
(c) Currency (exchange rate).
Factors (b) and (c) are by definition almost identical for these three ETFs and therefore cannot significantly influence the comparison we make below in our mini case study.
As just indicated, the composition of these three indices or ETFs differs in only one essential point: the average remaining term and therefore also the duration - and this is what matters - of the government bonds included. The duration of the first ETF is approximately two, which is why we will refer to it below as Duration 2 ETF designate. For the second and third ETFs, the duration is around four and seven, respectively, which is why they have their names with us Duration 4 ETF and Duration 7 ETF. [3]
The following graphic shows the price development of the three exemplary bond ETFs in the twelve months from April 30, 2021 to April 30, 2022:
Graphic: Price development of three bond ETFs on German government bonds with different durations from April 30, 2021 to April 30, 2022 (1 year)

Source: Own calculations with price data from Comdirect Bank AG
We remember: market interest rates rose by around one percentage point over the period measured here. According to the theory explained above, the prices of our three ETFs should have fallen by around two, four and seven percent. In Table 1 we have compared the duration and price changes of our illustrative bonds.
Table 1: Comparison of expected and actual price effects of three bond ETFs on German government bonds with different durations from April 30, 2021 to April 30, 2022 (1 year)


[A] Duration of the basket of bonds underlying the index (and therefore the ETF). /// [B] Source: Own calculations with price data from Comdirect Bank AG
What can be seen from the table? Over our observation period, the connection explained above can be clearly seen: the actual price changes of our bond ETFs are quite close to the price changes derived from the duration after a (slightly over) one percent increase in market interest rates.
The fact that the duration only approximately predicts actual price effects was to be expected and has several reasons, including: (a) the duration does not change linearly over time (so it would have to be recalculated every day); (b) ETF costs are not taken into account in the duration; and (c) the assumption of “other things being equal” does not hold in the real world, i.e. h. There are a number of other factors that influence the price of bonds. It is therefore important to emphasize that duration is a rule of thumb. (NB: If you want to know more, you should take a look at the somewhat more complex financial mathematical concept of convexity throw.)
In our experience as an asset manager and the associated insight into clients' portfolios immediately before they switch to us from a competitor, the duration of bond portfolios of wealthy private households is often in the order of five to ten and sometimes even significantly higher. In such cases, the negative price effect from the rise in interest rates over the last twelve months was comparatively high.
But there are also much longer-term bonds: For example, in 2017, the Republic of Austria became the first Euro country to issue a 100-year bond (ISIN: AT0000A2HLC4). Its price collapsed by over 35% from April 30, 2021 to April 30, 2022 due to increased market interest rates.
So what?! – Implications for investors
Investors will now ask themselves what this means for their portfolio and/or their investment approach. First of all, it depends on your initial situation. We have good news for those who have implemented their low-risk ("risk-free") part of the portfolio - the "risk anchor" in the portfolio - in accordance with our criteria (very low credit risk, very low interest rate risk, no exchange rate risk): you don't have to take any action at all because, on the one hand, the bonds in your low-risk part of the portfolio would only be affected to a very moderate extent by interest rate increases that may still be coming our way and, on the other hand, they would benefit relatively soon from the increased interest rates.
Since this argument is not self-explanatory, it is worth expanding on it a little further: Let us assume a bond ETF with an average remaining term of one year. This means that, on average, all bonds contained in it are exchanged for new ones after one year. Conversely, this means that - if interest rates rise today - after a year, all comparatively low-interest bonds will have been exchanged for bonds with higher interest rates.
On the other hand, investors who have individual bonds, bond ETFs or actively managed bond funds with a long duration in their portfolio must consider whether they want to continue to bear the higher interest rate risk associated with these bonds. If these investors are of the opinion that nominal interest rates will rise noticeably again above the current level, then these investors would have to sell the bonds in question before this expected increase.
In Gerd Kommer's world portfolio concept, the low-risk part of the portfolio is designed in approximately the same way as the "risk-free asset" in science: minimal duration risk, minimal credit risk and no exchange rate risk. However, in practice none of these three risks can be completely “zero”, as is assumed for the risk-free asset in science, since such assets do not exist in reality; However, there are assets that come fairly close to the specifications of the scientific model. That's how it will be in the Robo advisor strategy by Gerd Kommer and in asset management Gerd Kommer Invest implemented. There is therefore no need for action for these portfolios for investors who expect nominal interest rates to continue rising.
Last but not least, there is another aspect that many investors are often not really aware of: When interest rates rise, the prices of bonds and their current yields fall [4] but are increasing - although not to the same extent in percentage terms. So we have two opposing effects: (a) the one-off price decline and (b) the permanently higher interest rate in the sense of the current yield.
To return to our example: The current yields of our three ETFs as of April 30, 2022 amount to +0.26% (Duration-2-ETF) or +0.58% (Duration-4-ETF) or +0.80% (Duration-7-ETF) annually. Consequently, the difference between the Duration 2 and the Duration 4 ETF is 0.32% (=0.58% - 0.26%) and that between the Duration 2 and the Duration 7 ETF is 0.54% (=0.80% - 0.26%) p. a. To make this more tangible, we created another table:
Table 2: Case study - after the interest rate increase from April 30, 2021 to April 30, 2022, how long does it take to make up for the associated price decline for bonds (or bond ETFs) with longer durations compared to short-term ones?
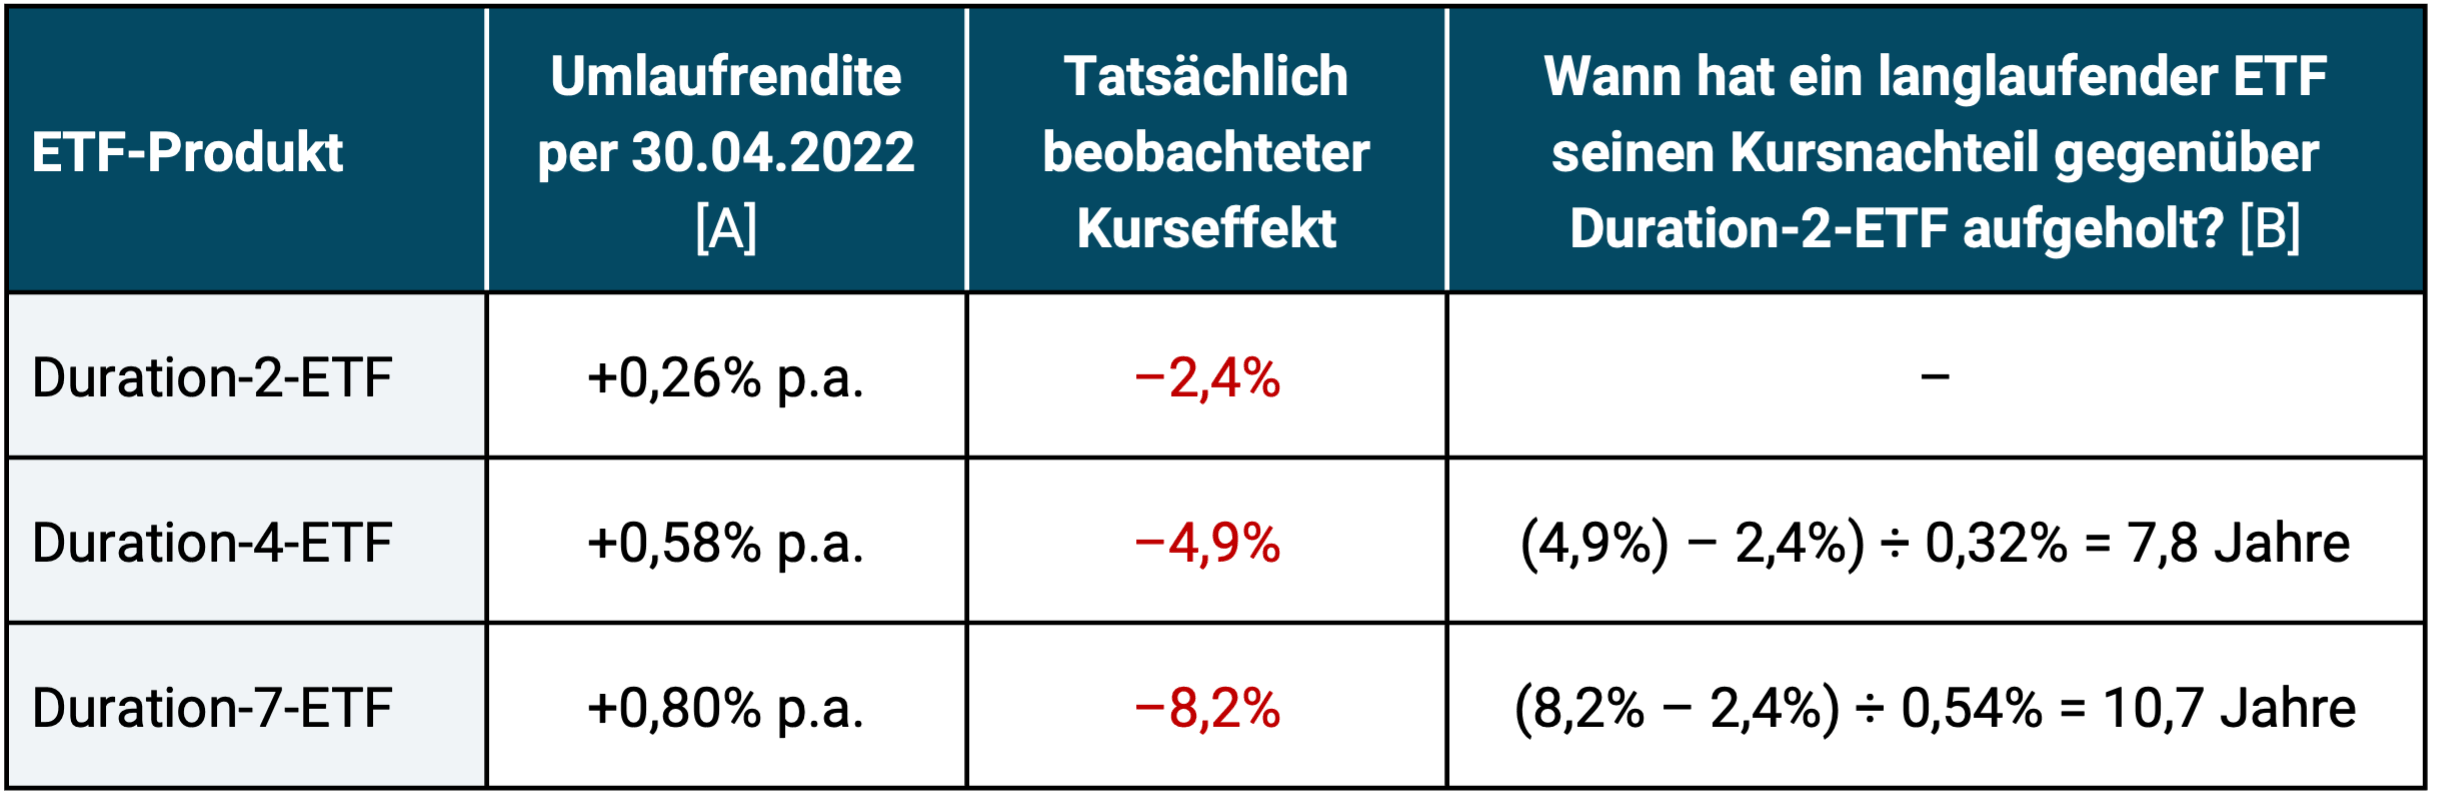
[A] The current yield corresponds to the yield to maturity, other things being equal (“ceteris paribus”). ► [B] Calculation example for the Duration 4 ETF: The difference in returns (4.9% minus 2.4%) is divided by the difference in current yields (0.58% - 0.26% = 0.32%) and this gives you the duration (in years) until the two products are "break-even" under otherwise identical circumstances.
Table 2 shows the opposing effects of immediate price declines and subsequent interest rate advantages as an example for the specific case of our German government bonds in the twelve months from the end of April 2021 to the end of April 2022. The last column shows that, under otherwise identical circumstances, it would take 7.8 years for the Duration 4 ETF to make up for the return disadvantage from the recent interest rate increase. The Duration 7 ETF will take 10.7 years, ceteris paribus, to reach this break-even point.
Long-term bonds (or bond ETFs) have a yield advantage over short-term bonds, assuming a normal (upward-sloping) yield curve. However, it is doubtful whether this advantage compensates for the lower interest rate risk of short-term securities. We believe that this is generally not the case. It is possible that the interest rate reduction trend that has been going on since the 1980s and is probably unique in terms of amount and duration in the last 300 years has been over since the beginning of 2021. To the extent that this hypothesis is correct, short-term bonds are now particularly attractive as risk anchors in the portfolio.
Investors who want to invest amounts of less than 100,000 euros in the low-risk investment (the “risk anchor”) can also use bank deposits as an alternative to bond ETFs, but only with institutions that are subject to the statutory deposit insurance of states with the highest credit ratings.
Conclusion
Interest rates have been rising for several months. Long-term bonds in particular are severely affected. The long-term interest rate risk, which has always existed but hardly materialized in the 40 years from around 1980 to 2021, reduces the stability desired in the low-risk part of the portfolio. Anyone who adds bonds to their portfolio in order to reduce its overall risk should therefore ensure that they are really low-risk and will not be affected too much if interest rates continue to rise. The last twelve months have been a foretaste of how bond interest rate risk can manifest itself in a capital market portfolio.
In our opinion, anyone who wants to increase the overall return of their portfolio should not do so by adding long-term bonds, but rather by increasing the percentage of the risky part of the overall portfolio. This is the only way to ensure the distribution of tasks in the portfolio between the “return engine” (risky part of the portfolio) and the “stability anchor” (low-risk part of the portfolio).
Endnotes
[1] The current yield for ten-year German government bonds rose from -0.21% to +0.82% over the period from April 30, 2021 to April 30, 2022, i.e. by a total of 1.03 percentage points. In the USA, the current yield rose from 1.65% to 2.89% during this period, an increase of 1.24 percentage points.
[2] Important: The ETFs mentioned are expressly not product or investment recommendations; we have selected them solely for illustration purposes.
[3] The durations stated here are commercially rounded values for reasons of simplicity. The exact duration values as of March 31, 2022 were 1.93 (vs. rounded 2.0) or 3.97 (vs. 4.0) or 7.25 (vs. 7.0).
[4] An old-fashioned, synonymous term for current yield is “maturity yield.” It is occasionally incorrectly stated/written that the word “yield to maturity” only refers to entire bond segments, while “yield to maturity” refers to a single bond.
literature
Kommer, Gerd; Schweizer, Jonas (2018): “The Principle of Sovereign Ceiling”; blog post; December 2018; Link: https://www.gerd-kommer-invest.de/konzept-der-sovereign-ceiling/
Kommer, Gerd; Schweizer, Jonas (2019): “The concept of the cash flow cascade”; blog post; January 2020; Link: https://www.gerd-kommer-invest.de/cash-flow-kaskade/
Kommer, Gerd; Weis, Alexander (2019): “The interest rate risk in bonds”; blog post; December 2019; Link: https://www.gerd-kommer-invest.de/zinsaenderungsrisk/