
From Gerd Kommer and Jakob Riemensperger
As we know from over 125 years of historical return data, stocks are the most profitable of all asset classes, but also one of the most volatile with a high temporary drawdown risk. In this blog post we address the question of how resilient an investment in the global equity asset class is, i.e. how low share prices can fall, how long it takes to recover after deep declines and what the prerequisites are for actually participating in sustainable recoveries.
The worst stock market crashes since 1900
Table 1 shows various downside metrics for the six worst global stock market crashes in the last 125 years. The criterion for these six stock crashes was a maximum cumulative loss (maximum drawdown) of at least 45% adjusted for inflation (in real terms).
For the period 1900 to 1970, the table considers U.S. stock market data rather than global data because only annual return data is available for the global stock market before 1970, not monthly data. However, in order to measure maximum drawdowns in a crash with sufficient accuracy, monthly data is required. Using annual return data results in less extreme, smaller drawdown numbers. Since the global stock market is relatively highly correlated with the US market, US data for this period represents a methodically justifiable - although not perfect - replacement. We also compared the drawdowns calculated on the basis of the US data with the global annual data values and verified them as plausible.
Table 1: Selected risk indicators for the six collapses of the US stock market or global stock market in the period from 1900 to 2024 with a maximum cumulative loss (maximum drawdown) of 45% or more in real terms
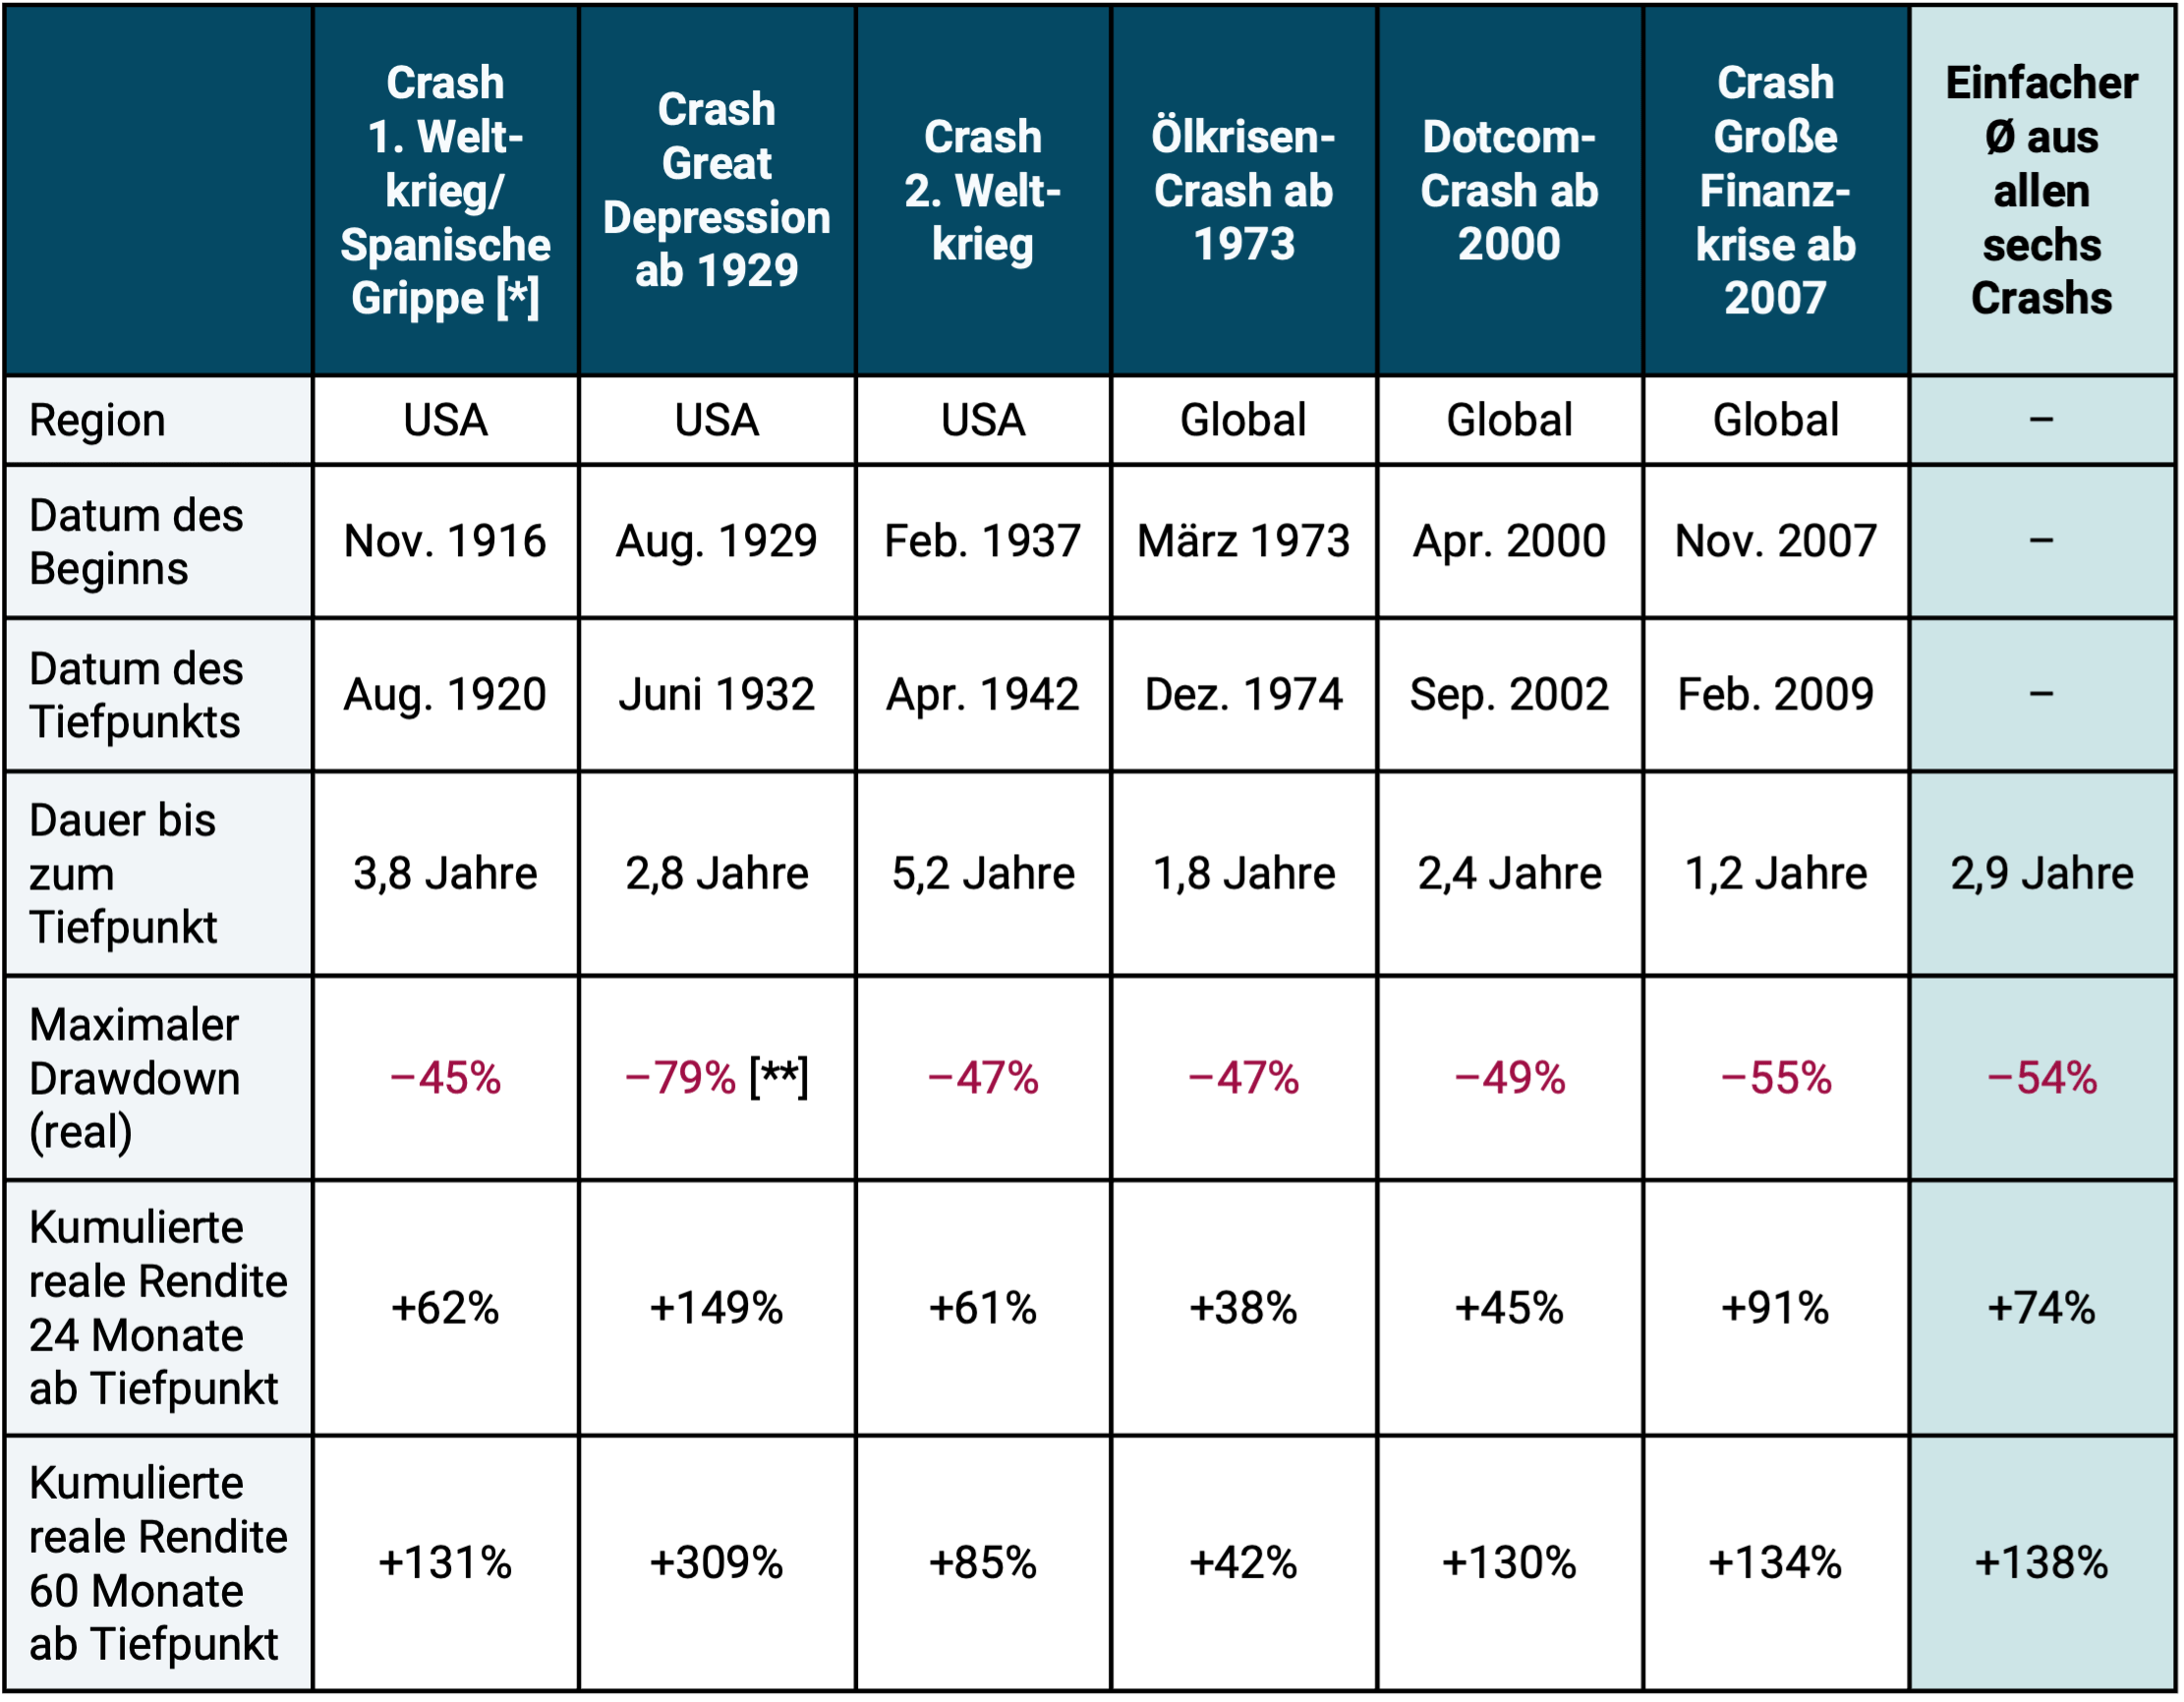
► In USD, adjusted for inflation, excluding costs and taxes. ► USA stock market in USD from 1900 to 1969 (S&P Composite Index 1900-1926, CRSP 1-10 Index 1927-1969), as no monthly returns are available for the world stock market before 1970. 1970 to 1987 MSCI World Standard Index, 1988 to 1995 MSCI ACWI Standard Index, from 1996 MSCI ACWI IMI Index. ► [*] Spanish flu pandemic: It lasted from February 1918 to April 1920. It is estimated that between 1% and 5% of the world's population at the time died. ► [**] The maximum drawdown shown here for the Great Depression Crash based on US stock market data is an overstatement/exaggeration (see explanations in the ongoing text below).
Table 1 illustrates that severe stock market declines have not been all that rare over the past 125 years - there have been six, including one during a dramatic pandemic. If the drawdown filter criterion had been chosen to be “softer” (e.g. real minus 30% instead of minus 45%), then there would naturally have been more than six stock market crises.
The Corona-related global stock crash from February 20, 2020, which is not included in Table 1, led to a collapse in world stock indices (e.g. the MSCI ACWI Index) of just under 40% on a daily return basis. However, in this case, the market only needed a short ten months after reaching the bottom to fully recover.
Myths about the 1929 crash
For the Great Depression Crash in the USA from 1929 onwards, representatives of the financial industry, in many advice books and by finfluencers regularly give incorrect, negatively exaggerated figures - both in terms of the depth of the stock market collapse and in terms of the time it takes for the collapse to fully recover. It is often said that the complete recovery took 25 years until 1954. In fact, six to seven years is correct, depending on which currency you use. The depth of the 1929 crash is also regularly misrepresented and exaggerated. The repeatedly claimed 89% slump is exaggerated by at least ten percentage points and, if you analyze a little more closely, probably even by around thirty percentage points. My colleague Felix Großmann and I go into this fascinating issue in more detail in a separate blog post (Link here).
In the global stock market - in contrast to the US stock market as a mere sub-market - the crash from 1913 to 1924 was the deepest since 1900, as well as the longest to complete recovery, and not the 1929 crash. However, as explained above, for the global stock market, data for this period only exists on an annual basis, not a monthly basis. The main causes of the 1913 crash are explained below. However, the crash of 1913 does not seem to exist for the majority of “experts” who generally comment on the risks of stock crashes. That gives you a deep insight.
How do major wars affect the stock market?
Judging from experience since 1900, major wars (major military conflicts involving at least one world power) have a less damaging impact on the global stock market than major economic crises. This is shown by the data in Table 2.
Table 2: Global stock market returns during what are believed to be the seven largest international wars in the last 125 years – real in USD
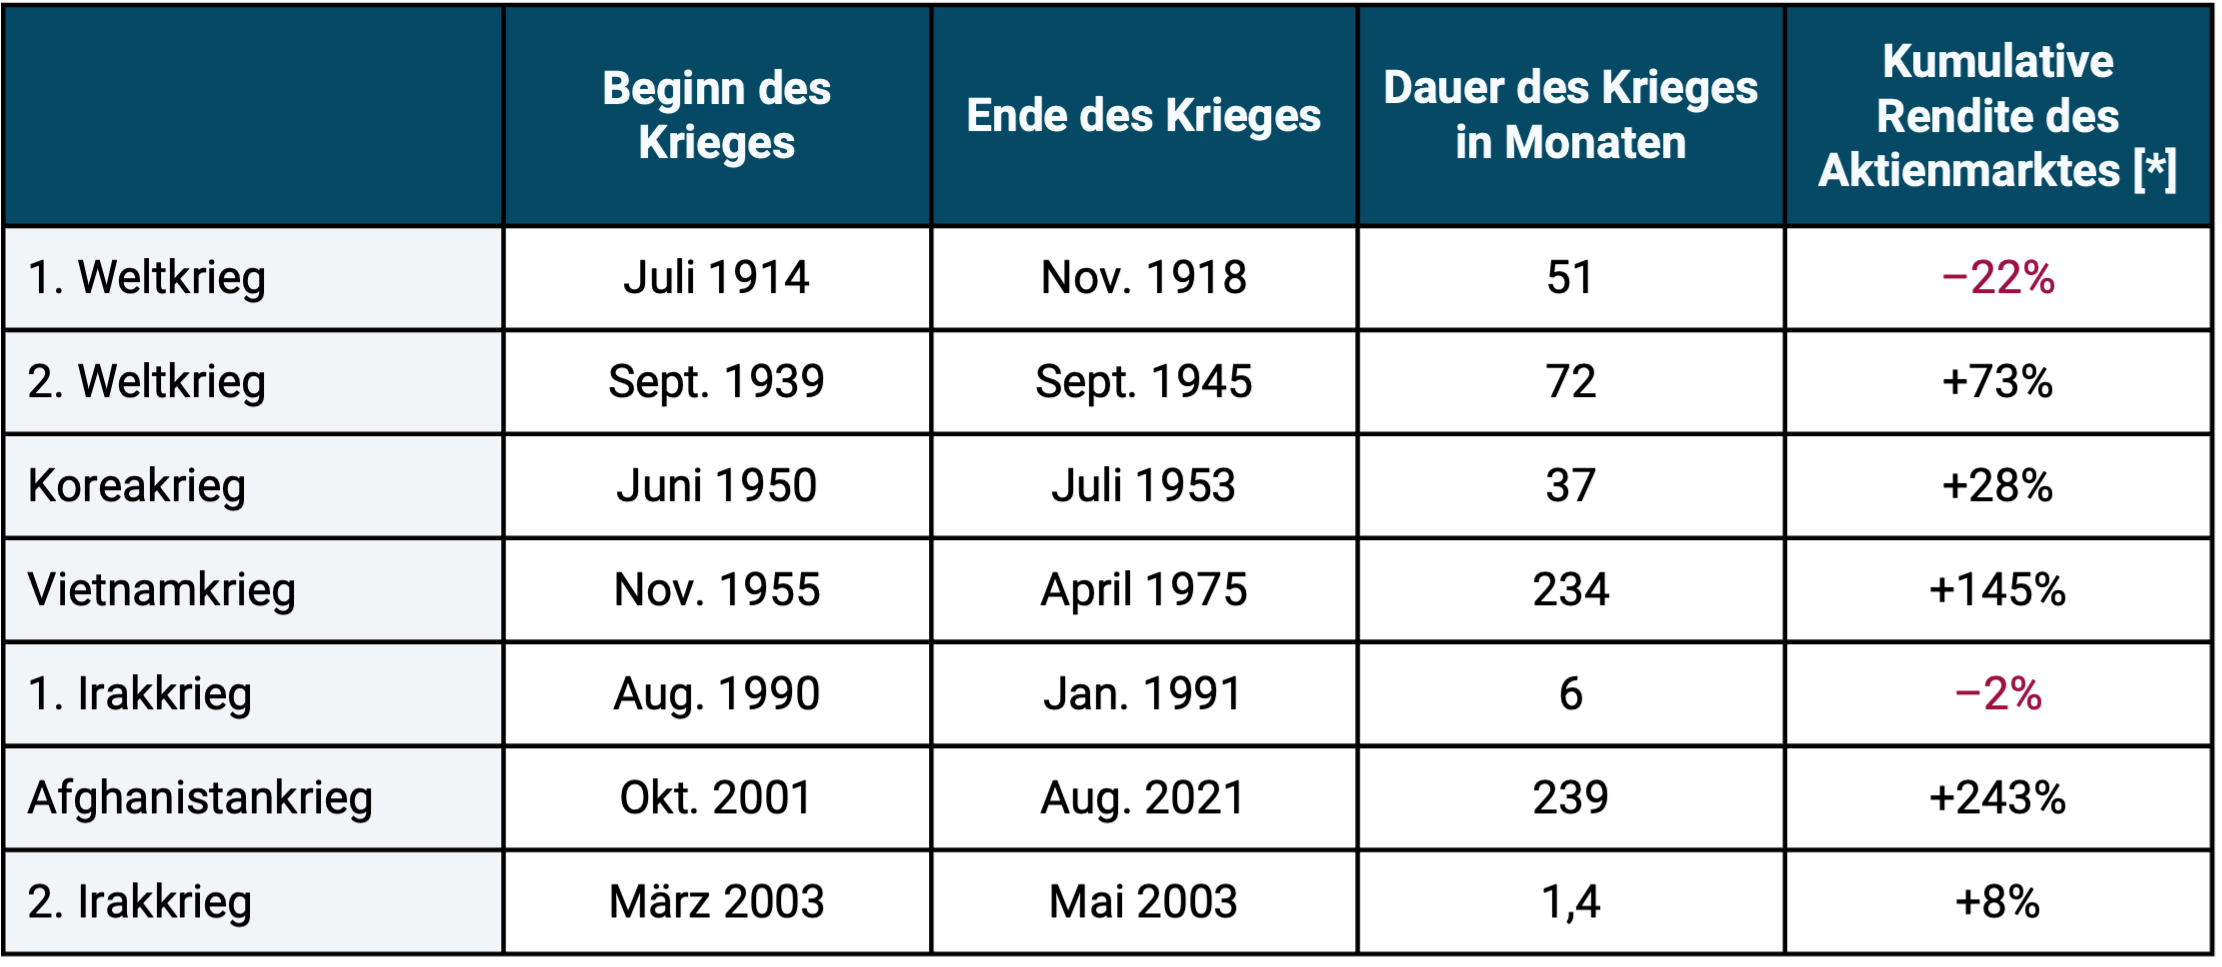
► In USD, adjusted for inflation, excluding costs and taxes. ► Data as in Table 1. ► [*] Initially US stock market, later world stock market ► Return calculated at the end of the month following the last month of the war.
With the exception of the First World War, there was no significant negative return on the global stock market over the entire duration of any of these terrible conflicts. If the conflict lasted longer than a few months, prices on the world stock market rose by double or triple digits by the end of the war. The particularly long-lasting wars, such as the Vietnam War and the Afghanistan War, show that these do not stop the long-term upward trend of the global stock market.
The Russia-Ukraine war, which is currently ongoing, led to a relatively moderate decline in the global stock market of around 10% when it began in February 2022. Later in 2022, the stock market experienced another sharper drawdown due to a sharp rise in global interest rates, which was probably due to general macroeconomic causes rather than this conflict. Either way, in September 2023, the world stock market, calculated in euros, had made up for all losses since February 2022.
What the return figures in Table 2 do not show: At the beginning of the seven wars examined, there were often clearly double-digit losses on the stock markets. However, these were usually completely made up for quite quickly as the conflicts progressed. In the majority of cases there were even significant price gains by the end of the war relative to the price level at the beginning of the war. This pattern should not be surprising: If the end of the war becomes sufficiently clear for investors, this will normally boost the stock market because the optimism of market participants will then increase again and the previously priced risk expectations will decrease.
The exception of the First World War in terms of the complete stock market recovery by the end of the war is likely to be explained by two special factors. On the one hand, the most serious pandemic in the last 100 years, the Spanish flu, began in February 1918, ten months before the end of the war (see footnotes to Table 1). Strictly speaking, this pandemic had nothing to do with the war, but it coincided with its final phase. The major monetary policy mistakes made by the central banks at the time may have had an even more serious impact. Depending on the country, between 1914 and 1933 they left the classic gold standard, a currency system in which the central bank guaranteed a fixed exchange rate for gold for all or most of the banknotes issued. [1] This state-initiated exit was amateurish and downright chaotic in many Western countries, which certainly had a negative impact on the stock market. (If you would like to read about the history of the gold standard and its disadvantages, you can find a separate blog post by my co-author Felix Großmann and me - link here.)
The bounce-back effect in the stock market
In Table 3 we carry out a slightly different analysis for the global stock market in the shorter period from 1970 to June 2025 (55.5 years). During these five and a half decades, the world stock market produced a real return of an average of 5.4% p.a. (in DM or euros). In the table we look at what happened in the subsequent periods after a real drawdown of at least 25%.
Table 3: The “bounce-back effect” in the global stock market from 1970 to June 2025 after a real drawdown of at least 25%
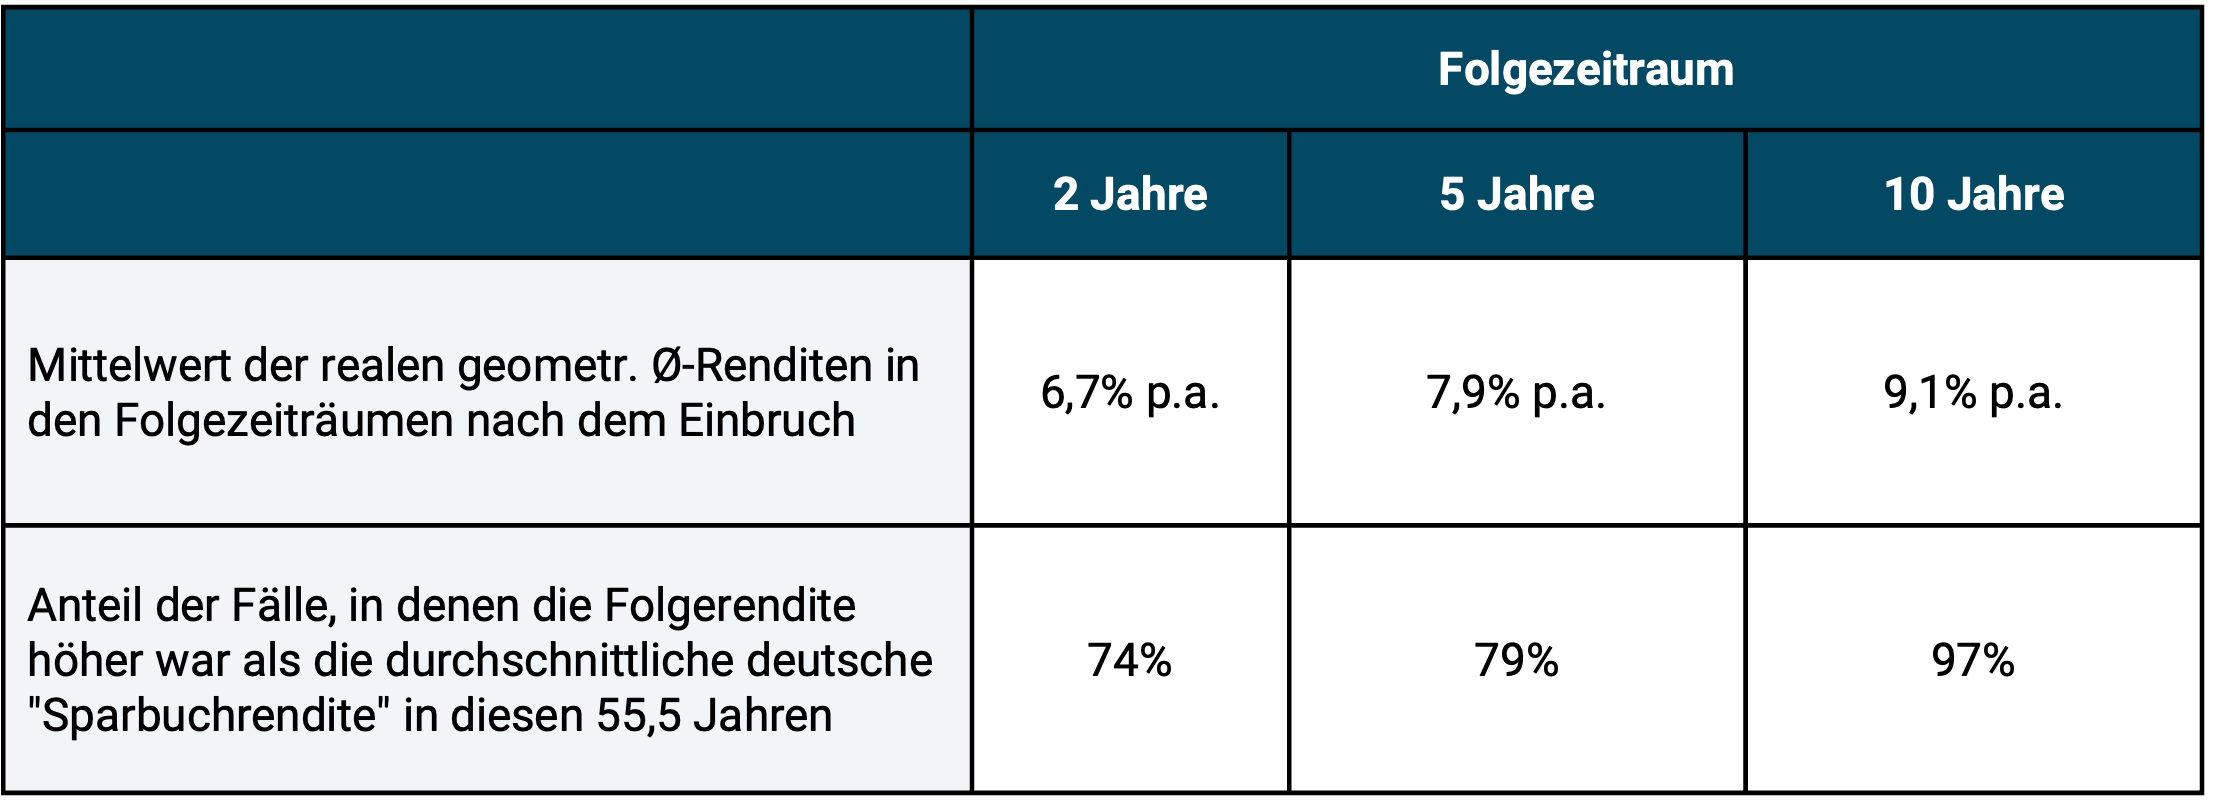
► In DM or Euro, adjusted for inflation (real), without costs and taxes. ► Real average return over the entire 55.5 years: 5.4% p.a. ► Data: MSCI World Index.
Here, too, we observe that in the average (but not every individual) subsequent period, be it two, five or ten years, there was an above-average return, a “bounce back”. This effect is likely related to the so-called “regression to the mean,” a statistical “reversion to the mean” phenomenon that exists in many markets, including the stock market.
Incidentally, it is likely that book losses (drawdowns) in the event of, for example, B. a 50% stock market collapse would be lower for a given investor with a globally diversified stock investment on a buy-and-hold basis based on his personal, case-specific constellation. You can never be higher. Reason: The profits that may have accrued before the crash began, as well as potential non-stock investments within the overall portfolio. Only very few broadly and globally diversified B&H investors will have invested their entire assets in stocks and will have purchased this stock investment exactly at the start of the crash, which is what all the considerations in this blog post assume. Our calculations therefore take a somewhat unrealistic worst-case perspective.
Conclusion
As the past 125 years show, the global stock market has demonstrated remarkable resilience, despite many “extreme stress tests” occurring over this long period. This is why the world stock market is also referred to as an “antifragile system”. This should give anyone who invests the way Gerd Kommer has been advocating for over 25 years, namely globally diversified on a buy-and-hold basis, the knowledge and peace of mind not to throw in the towel, even in difficult market phases. For example, throwing in the towel could mean selling in a sharp downturn, turning mere book losses into likely terminal losses.
Unfortunately, the “mathematical consolation” presented in this blog post does not apply to investors who engage in stock picking or market timing. Anyone who invests speculatively in individual stocks, individual sectors or individual countries - generally in an insufficiently diversified stock portfolio or who tries to beat the market by going in or out - will not see an inevitable recovery. Neither the compelling economic logic nor the calculations in this blog post apply to this investor. Final 100% losses are possible for individual values. A “soon” bounce-back after a severe drawdown can never be expected with sufficient certainty for individual stocks or other stock portfolios that are not systematically broadly diversified. The same goes for market timing with asset classes.
If you don't want to experience a maximum drawdown (MDD) of around 50% in your own portfolio, you can set the MDD limit of your portfolio to any extent "softer" with a correspondingly more conservative asset allocation - i.e. a higher proportion of low-risk investments - which of course has an impact on the expected return of the portfolio. How exactly this can be implemented is shown in Gerd Kommer's books.
Endnotes
[1] Pure book money - money that had no physical banknotes - did not exist at that time, if you exclude “bills of exchange” (short-term promissory notes from companies).