
From Gerd Kommer and Maximilian Bartosch
This blog post will answer the question posed in the title. At the same time, it is a case study of how a reputable daily newspaper World, “Investment Pornography” [1] spread. It's about this article in the online edition of the world from March 7th, 2024. [2] The text has the cocky clickbait title “19 years early to make a million – this savings plan clearly beats the world index”. [3] (With “this savings plan” we mean an ETF savings plan based on the American Nasdaq 100 stock index, with “world index” the MSCI World index.)
Here are the main statements from the Welt article in quote form:
"Anyone who had put 100 euros a month into a Nasdaq 100 savings plan since the start of the Nasdaq 100 index in 1985 would have been a millionaire since 2021 and would have assets of 1.3 million euros today [in February 2024]. A similar savings plan in the MSCI World index, on the other hand, currently only amounts to 283,545 euros."
"The world presents the miracle index. With it you can ignite the turbocharger in wealth creation."
“At a time when technology is increasingly ruling the world, it makes sense to save money in a broad tech index.”
As the last of the three quotes and other statements in the article express, the article suggests that tech stocks have structurally higher returns than the rest of the stock market. (Tech stocks make up about 60% of the Nasdaq 100 index.)
The three statements quoted form the core of the Welt article. All three are highly questionable or completely wrong. Ultimately they provide Investment pornography - to generate attention while often ignoring the facts as an expert or scientist free of conflict of interest would assess and present them.
We analyze the journalistic debacle by critically examining the key claims and recommendations in the article.
But before we do that, let's take a quick look at the downright bizarre construction of the Nasdaq 100 index. Even this small analysis exercise raises big question marks regarding the usefulness of a significant passive ETF investment in the Nasdaq-100.
The bizarre construction of the Nasdaq 100 index
The Nasdaq-100 is structured as follows:
(a ) First, a company must be listed on the US Nasdaq Stock Exchange (one of the three US stock exchanges) to be eligible for inclusion in the Index. Since virtually no US company has a listing on more than one US stock exchange (although multiple listings are possible in principle), a company listed on the largest US stock exchange, the NYSE (New York Stock Exchange), will effectively never be a member of the Nasdaq 100 index. Currently, not a single Nasdaq 100 member has a listing on the NYSE.
(b) The company may belong to any industry, except the financial sector.
(c) Among the companies that meet criteria (a) and (b), the company must be among the 100 largest by market capitalization.
(d) There are upper limits (caps) for the weight of individual stocks and sectors (industries). These caps are not subject to any rules and are changed at random intervals by the Nasdaq Index Committee.
The Worldarticle doesn't mention any of these weird facts about the Nasdaq index.
Tech companies, including telecommunications, currently have a weight of 62% in the Nasdaq-100, which is why the index is described as “technology-heavy”.
From this index construction, which is strange compared to all other known stock indices, one can deduce what the Nasdaq-100 is not: (a) It is not a country index or national index because, like a real country index à la DAX or MSCI Australia, it does not neutrally reflect all listed companies in a country, provided they meet certain economic criteria. (b) It is not an industry index. The Nasdaq-100 represents all industries except the financial sector. (c) It is not a topic index, such as B. an index that reflects the area of AI or hydrogen and (d) it is not a “factor index” (smart beta index) such as B. a small cap stock index or a momentum index.
No other internationally known stock index is based on a construction plan similar to that of the Nasdaq-100. And because the Nasdaq 100 structure only follows very limited economic logic, but primarily the company's marketing goals, which change over time Nasdaq, Inc., the relatively good absolute return of the index from 1985 (the start date of the index) to today is likely due to chance - just as any arbitrarily determined ex ante sub-segment of the overall market will have a higher or lower return than the overall market in a historical time window, no matter how long it is. In view of this, the devout and anthemic celebration of the Nasdaq 100 returns (“miracle index”) by the World a bit embarrassing.
Large clumps and concentrations can be seen in the index, and not just in terms of the industry representation. The ten largest individual members currently make up 47% of the index, the 20 largest 63%. This is the opposite of diversification and passive investing.
Now that we know the most important structural features of the Nasdaq-100, now to our actual concern, the statements in the World-To subject articles to a sober examination.
WELT claim 1: A savings plan of 100 euros per month on a Nasdaq 100 ETF from 1985 to 2021 would have led to a portfolio value of one million euros.
Not true. The million would not have been achieved because the calculation of the World ignores several factors that reduce returns. In order to keep our blog post relatively short, we will only mention the most important factor.
The journalist ignores ETF costs and taxes in his calculation, although in reality both are incurred. If costs and taxes were taken into account, our fictitious ETF saver would not have reached a sum of 1.0 million euros with his portfolio in March 2021 after 35.5 years, but far less - according to our calculations, only around 550,000 euros. [4] The big discrepancy between the World The calculated final asset value (before costs and taxes) and our final asset value (after costs and taxes) has to do with the “negative compound interest effect” in this case: We all know that due to the compound interest effect, even relatively small percentage differences in per annum returns over long investment periods (here 35.5 years) make an enormous difference in the final asset value. Taxes and costs reduce the return on the savings plan between 1985 and 2021 from 14.4% p.a. “gross” to 11.7% p.a. “net” and this in turn leads to the drastically lower final asset value in 2021. [5]
That the fictitious Nasdaq 100 saver World In these 35.5 years, compared to better diversified stock index investments, we will show you below that you would have had to endure almost martially violent and almost hopelessly long-lasting slumps in your portfolio without throwing in the towel (sell early) out of stress and desperation.
The “small detail” that should also be mentioned is that the earliest ETF available in Germany on the Nasdaq 100 index was only launched in September 2001: 16 years after the start of our simulation calculation World-Experts. This “detail” remains World-Article also not mentioned.
WELT claim 2: The Nasdaq-100 is a “miracle index”.
As our index excursus shows at the beginning, the opposite is probably true. The Nasdaq-100 is a technically curious “one-stock exchange index” with worse returns than the obvious alternatives.
Table 1: Comparison of the historical returns of three tech ETFs (in euros, nominal)
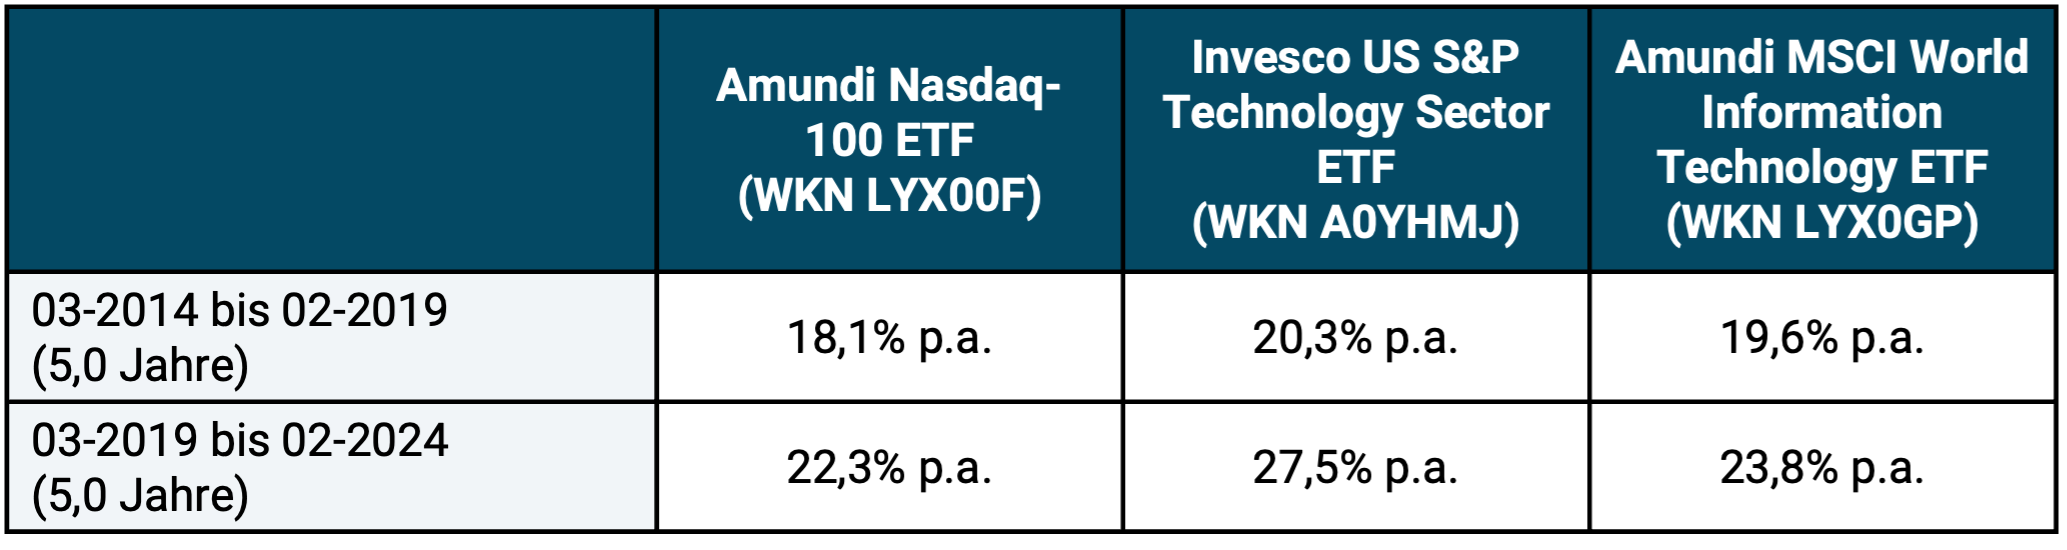
► All returns in this blog post are total returns (including dividends). ► Data sources: Fondsprofessional.de.
The data in Table 1 indicate that a real US Technology Index ETF as well as the MSCI World Information Technology Index are the “miracle index”. World has struck in the last ten years. The Nasdaq 100 ETF also performed worse than the two alternatives when it came to risk in the form of the maximum drawdown.
In her article she compares World the Nasdaq-100 only with the non-tech index MSCI World. In fact, since the Nasdaq-100 data history began in 1985, it has outperformed the MSCI World and even the S&P 500 Index. But only if you ignore the risk involved. You don't have to be an investor genius to realize that returns are only one side of the investment coin. When it comes to the other side, risk, the Nasdaq 100 index turns out to be a clear loser against a number of conceivable investment alternatives. This is illustrated in Table 2.
Table 2: Return and risk of the Nasdaq 100 index and three selected alternatives from Oct. 1985 to Feb. 2024 (38.4 years) - in USD, nominal
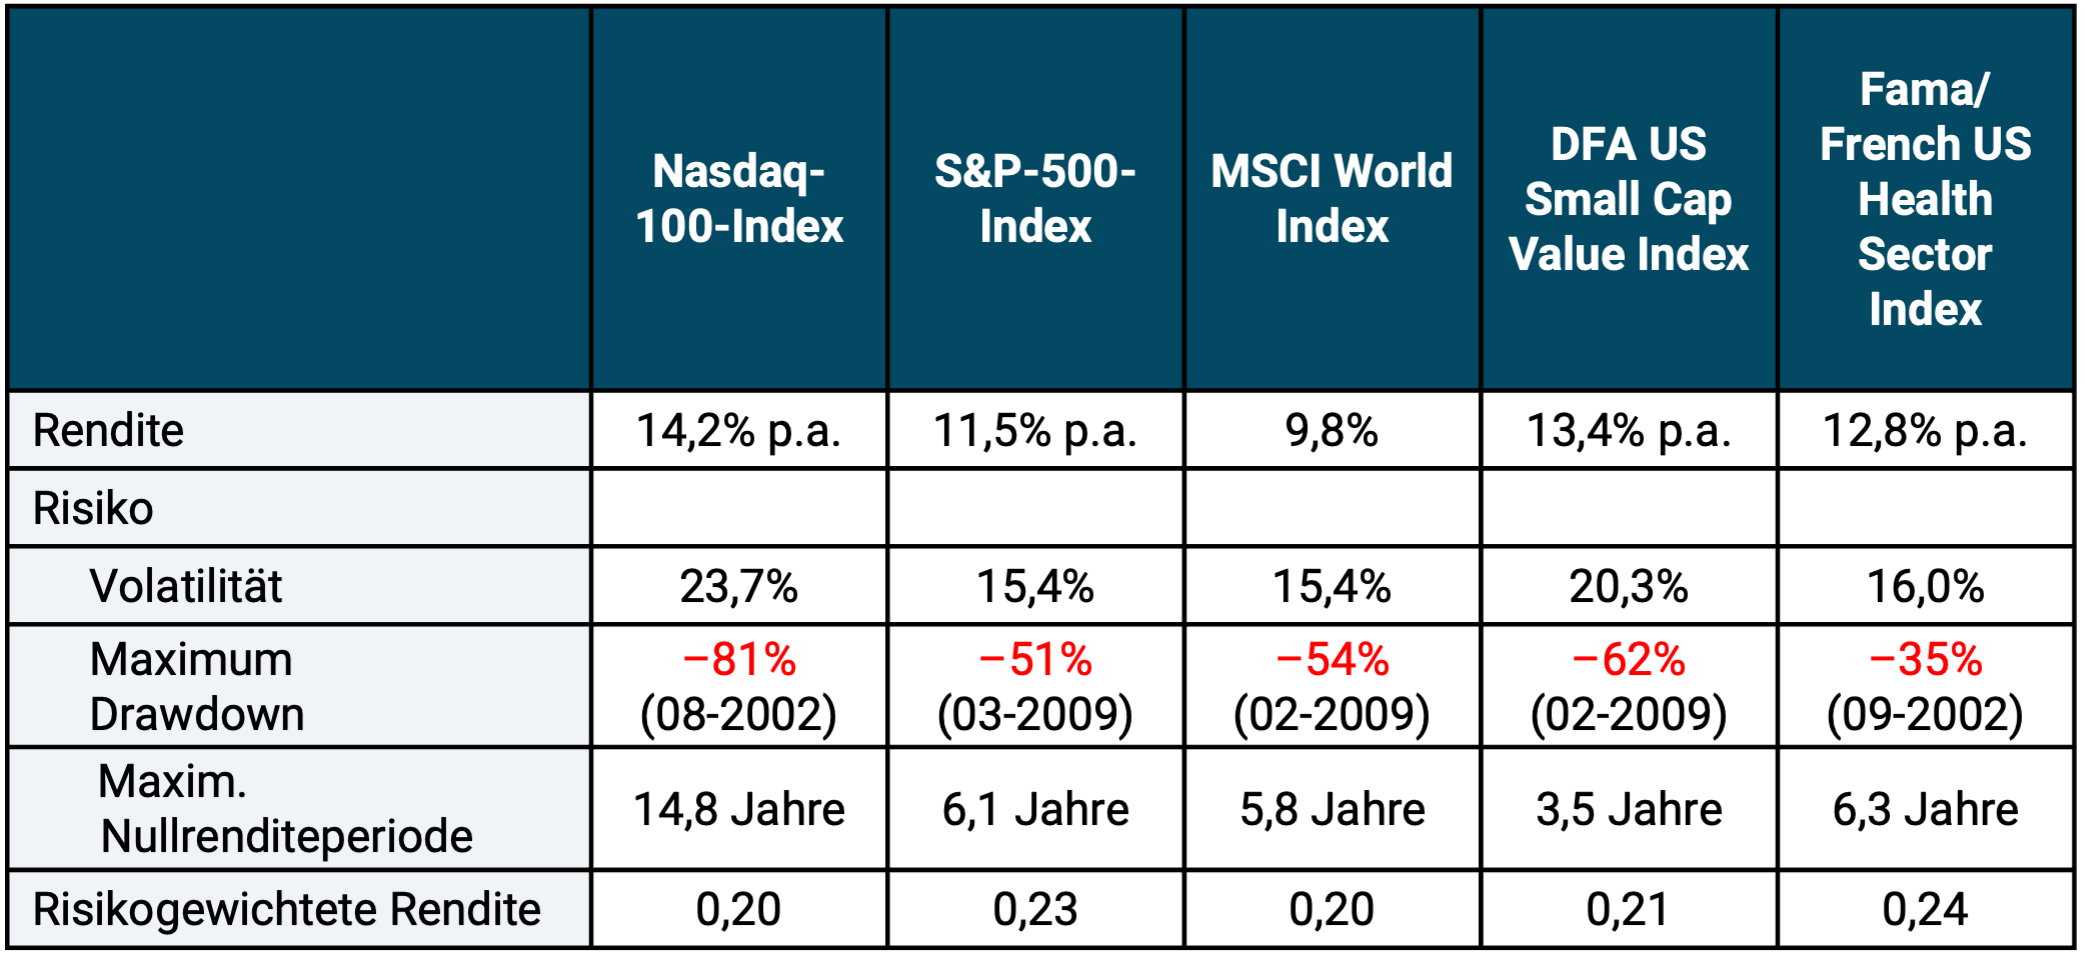
► Before costs and taxes. ► Maximum available period. ► Volatility = annualized standard deviation of monthly returns. ► Risk-weighted return = Simplified Sharpe ratio (Ø arithmetic monthly return ÷ standard deviation of monthly returns). ► Max. zero return period = the longest time window in the observation period in which the index produced a nominal zero return. ► DFA US Small Cap Value Index = Dimensional Fund Advisors USA Small Cap Value Index (an index that tracks cheaply valued small cap stocks). ► Data sources: Yahoo.com, Dimensional Fund Advisors, Ken French Data Library
For all risk metrics shown in Table 2, the Nasdaq 100 index performs drastically worse than the investment alternatives. Imagine for a moment the brutal maximum drawdown of 81% of the Nasdaq-100 combined with a period of almost 15 years, which is probably unbearable for normal investors, until the index is back in the “green zone” after the start of its slump: 15 years of red numbers in the portfolio.
The risk-weighted return in the bottom row of Table 2 shows that the return advantage of the Nasdaq-100 over the three alternatives was too small to compensate for its significantly higher risk.
The world journalist points out the particularly high historical risk of the Nasdaq-100, but seems to consider it secondary.
Keyword alternatives: With regard to Table 2, someone could raise the accusation that we have specifically selected some of the comparison alternatives (all of which can be invested via conventional index funds or ETFs) in Table 2. Yes, we have that, but that's exactly what he has World-Journalist also did that. It arbitrarily has a specific, narrow, poorly diversified stock index ex post picked out from a variety of national or sectoral stock indices, solely because it has delivered a higher absolute return than the MSCI World Index among well-known stock indices (or ETFs) in this particular period to date. More “data mining” and “look-back bias” are hardly possible anymore. [6]
And as already indicated: A German private investor household could not realistically have started investing in the Nasdaq 100 index in 1985, but only 16 years later in 2001. But even if an investment had been possible from 1985 onwards, a normal private investor - whether in Germany or the USA - would most likely not have chosen the then completely new Nasdaq 100 for a stock savings plan. His “big brother”. Nasdaq Composite Index, which had existed since the Nasdaq stock exchange was founded in March 1971, had underperformed the S&P 500 index, which had already been established for 30 years, from 1971 to September 1985 by a whopping two percentage points per annum. What rational reason was there for the launch of the Nasdaq-100, given the need to invest in such an adventurously structured, new, untested index?
WELT claim 3: Tech stocks have higher long-term returns than the overall market.
That's what it implies Worldarticle and many investors actually take this for granted. However, this idea cannot be proven with long-term historical data. Nor with the findings of science or economic logic.
First of all, the historical data. We look at the US stock market, for which long-distance sector return data of high quality and granularity is available.
Table 3: Return and risk of two major industries and the entire US stock market - in USD, nominal from 1984 to present
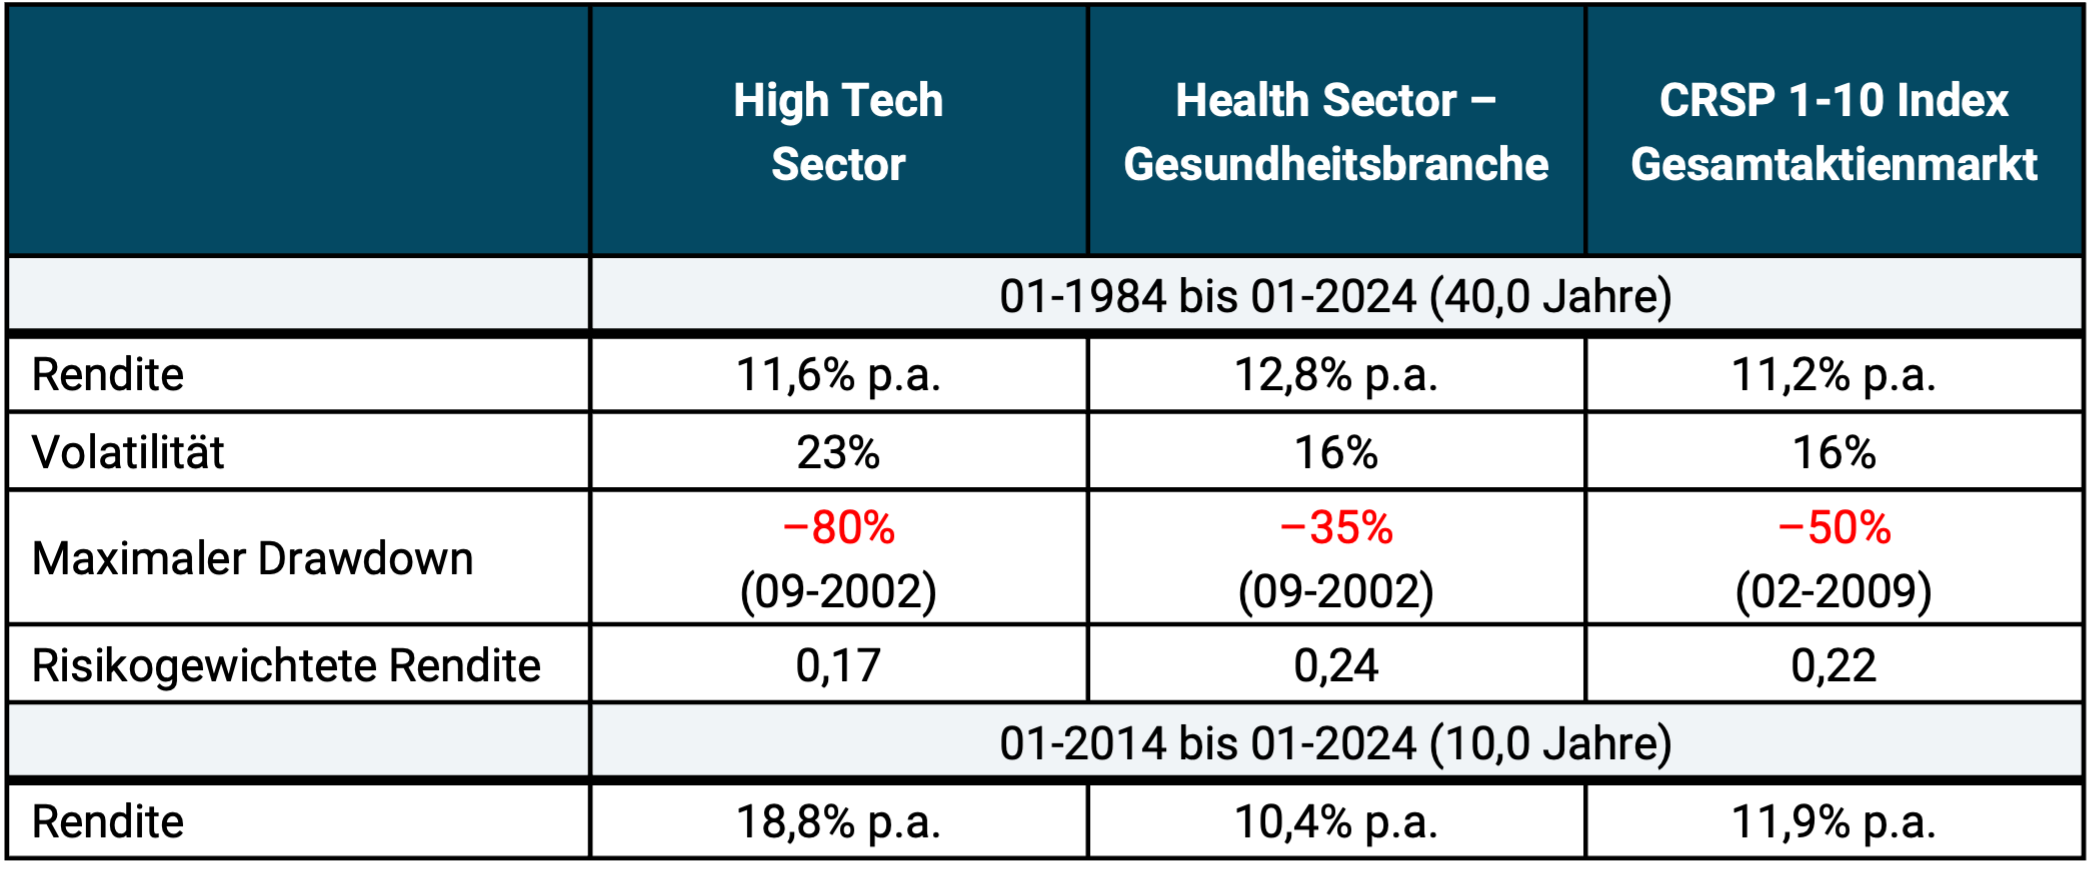
► Before costs and taxes. ► Volatility: See footnotes to Table 2. ► Risk-weighted return: See footnotes to Table 2. ► Data sources: Ken French Data Library
The numbers in Table 3 should leave little doubt: In the long-term past, the tech sector has not produced significantly higher returns than the overall market and has produced worse returns than the actually most profitable macro industry, health. Measured by the risk-weighted return (the Simplified Sharpe ratio), the Nasdaq-100 was far worse than the overall market and than the majority of all other individual sectors/industries.
If you want to get a quick overview of what science says about the supposedly structurally higher long-term returns of tech stocks, we recommend the article by Bessembinder (2020). The bottom line from this empirical study is the same as that expressed in Table 3: Tech stocks have had lower returns than many other industries over the last 70 years and a particularly high risk, which is reflected, among other things, in the particularly high probability of bankruptcy of an average tech company. We can currently see this happening among e-car manufacturers around the world.
If you take returns into account and Risk, then in the long term the tech sector falls into the group of below-average sectors.
Simple economic logic also speaks against the tech sector being structurally more attractive from an investor perspective. Yes, of course this sector (as defined for stock market purposes) is a key driver of technical progress and therefore economic growth within the economy, but the fruits of this technical progress do not only or even predominantly benefit the tech sector, but all sectors. This is ensured by market economy competition and partly also by the state with its anti-monopoly policy.
Furthermore, to the extent that the tech sector generates higher business profit growth rates or accounting returns on equity than other sectors, these are very quickly priced into the stock market. Almost always too fast to have invested in advance. This is ensured by the high information efficiency of the market.
The fact that many journalists, finfluencers and private investors still believe in the legend of consistently high tech returns is probably due to the error in thinking Recency Bias [7] related. The error in people's thinking, which has now been proven thousands of times by science, is to mistakenly view data from the recent and recent past as particularly representative of the future and to extrapolate these "mini samples" more or less linearly into the future.
Is the US stock market the most structurally profitable national stock market?
The World article doesn't say it explicitly, but overall it gives the impression that the US stock market produces higher long-term or structural returns than other national stock markets. Is that really true?
This thesis is widespread in the financial media and on the Internet and is often “backed up” with selectively selected data. However, as the numbers in Table 4 show, this is not the case. The only thing that is actually true about the “exceptionalism” thesis for the US stock market is that of the half dozen historically most profitable national stock markets, the US is the largest.
Table 4: Inflation-adjusted (real) historical returns in USD of five particularly profitable national stock markets

► Before costs and taxes. ► Data sources: Dimson, Marsh, Staunton
Incidentally, there is a clear consensus in academic financial economics that the historical US stock market returns, which are relatively high compared to international standards, do not mean that this will remain the case in the future (see e.g. van Binsbergen et al. 2022). When some journalists, finfluencers and private investors see or portray the US market as structurally more profitable than the sum of the markets excluding the US, we believe that this only shows how unfamiliar these people are with the academic literature and historical data on the matter.
The question arises as to why so many private investors assume that US stock market returns are, so to speak, uniquely high. The following three main reasons are likely to be responsible for this: (a) The one already mentioned above Recency Bias. Because US stock returns have been very high over the last decade or so, many naively assume that this is “normal” or “always” the case. (b) Tech stocks have a disproportionate weight in the US stock market. Many journalists, finfluencers and private investors are under the misconception that tech stocks have structurally higher returns than the rest of the stock market, again because that has been the case for the last 10+ years. (c) The German media is strangely fixated on the USA across all subject areas - politics, culture, sport, music, art, economy, society - one could almost say obsessed with the USA, although there are around 195 other countries in addition to the USA and Germany and although many of them have been as successful or even more successful than the USA in certain economic areas in the last 50 years or 25 years - such as the stock markets of the Netherlands, Denmark and Sweden mentioned in Table 3. But these more successful markets will not perceived because you just stare at the USA.
Is a Nasdaq 100 ETF suitable as a portfolio addition?
We have now seen that the Nasdaq-100 is highly questionable as a standalone investment.
What does it look like if you consider the Nasdaq simply from the perspective of, say, a ten percent addition to a broadly diversified “world corporation” stock investment? [8]
In our opinion, the Nasdaq-100 is a bad choice for this too. With such an addition, the triple cluster risks of “USA”, “tech sector” and “weight of the largest 10 or 20 individual stocks”, which usually already exist in a typical global AG investment à la MSCI World ETF, would be driven up even further.
In addition, the Nasdaq-100 currently represents extremely highly valued, expensive stocks. The index had a P/E ratio of just under 38 at the end of February 2024, compared to 24.5 for the S&P 500 and 21.7 for the MSCI World. The historical average P/E ratio, which indicates a normal (“fair”) valuation, is 17 to 18. [9] At an asset class level, high valuations mean low expected returns in the future. It is the high returns on tech stocks over the last 10 to 15 years that have led to the current very high valuations, and these high valuations are likely to produce subpar returns going forward. [10]
Conclusion
The Nasdaq-100 is certainly not a “miracle index” that makes ETF savers millionaires faster, outside of weird data mining calculations, than a more logically constructed, more broadly diversified and now more conservatively valued stock index.
Even for those investors who are consciously seeking a focused ETF tech investment, superior alternatives to Nasdaq-100 exist, but at least a Nasdaq-100 ETF will very likely provide better long-term returns than the vast majority of actively managed tech stock funds and do-it-yourself stock picker portfolios.
Investment pornography like them World in her article “19 years earlier to become a million with the Miracle Index” is unfortunately also appearing more and more frequently in the so-called serious media, including public broadcasting. On the Internet, financial pornography is no longer the exception but the rule.
If you want to become a successful investor, you have to develop a sensitive mental radar for “financial porn” in order not to be led astray by it at some point when making an important investment decision.
Endnotes
[1] Investment pornography are sensational statements from the financial media and the financial industry that suggest: Anyone can get rich quickly with little risk and little work. Financial pornography exploits ignorance on the investor side and appeals to greed, FOMO, envy, laziness (getting rich without work and effort), impatience, naivety, overconfidence and ignorance.
[2] The text is behind the paywall, but you don't need to have read it to understand our blog post. We explicitly repeat his key statements in this regard in our blog post.
[3] “Clickbait” with exaggerated or lying headlines.
[4] The World points out the omission of costs and taxes “in the small print” of the article, but does not provide any figures.
[5] This return is calculated using the method Internal rate of return calculated.
[6] Data mining, also Data snooping (“to snoop” = to sniff) or Data Dredging called "to dredge" is the targeted selection of data or the targeted ignoring of "unsuitable data" in order to be able to show a specific result. Data mining can occur unconsciously (innocently) or consciously (intentionally).
[7] “Recent” = recently, recently; “Bias” = inclination, tendency, imbalance.
[8] By “global stock investment” we mean a passive buy-and-hold investment in one or more stock ETFs that together represent, if possible, all countries and all sectors.
[9] If the calculation is based on data that goes back further than around 30 years, the historical average P/E ratio continues to fall to around 15.
[10] We just don't know when exactly the low returns will start.
literature
Bessembinder, Hendrik (2020): “Extreme Stock Market Performers, Part II: Do Technology Stocks Dominate?” July 2020; Internet reference: SSRN
van Binsbergen, Jules et al. (2023): “Is The United States A Lucky Survivor: A Hierarchical Bayesian Approach”; October 9, 2023; Internet reference: SSRN