
From Gerd Kommer and Jakob Riemensperger
The fact that up to 90% or more of all actively managed investment funds fail to achieve the return of the general market for investment periods of five years or more has been proven almost infinitely over the past 60 years. Fortunately, many private investors are now aware of this important research result. But anonymous statistics are one thing, concrete individual cases are another. In this article we will therefore individually examine the performance of six particularly large flagship investment funds sold in Germany. [1]
Gerd Kommer's misery-free flagship fund: The L&G Gerd Kommer Multifactor Equity UCITS ETF. Find out more >
The six funds examined, their respective investment volumes and their parent company are:
Equity funds:
- DWS Top Dividend – Fund volume €17.9 billion – DWS (Deutsche Bank)
- UniGlobal – volume €10.2 billion – Union Investment (cooperative banks)
- Templeton Growth Fund – volume €7.0 billion – Franklin Templeton/USA
Mixed funds (stocks/bonds):
- FvS Multiple Opportunities – Volume €24.7 billion – Flossbach von Storch
- Private funds controlled – volume €19.3 billion – Union Investment
- Carmignac Patrimoine – volume €10.9 billion – Carmignac Gestion/France
We can anticipate the main result of our analysis: There is a lot of room for improvement in terms of returns for all six fund giants.
Are the six funds representative of their respective genres? Rather not. As a group, they are likely to have a higher long-term return than the average of their competitors. Otherwise, these funds would not have grown to their enormous size today. With rare exceptions, funds that consistently produce below-average returns hardly attract any investor funds.
Let us now look at the performance of each fund in comparison to an appropriate benchmark. The choice of benchmark depends on the fund's published investment strategy.
(1) DWS Top Dividend LD (securities identification number (WKN) 984811) – fund company DWS – equity funds – fund age 18.5 years – fund volume 17.9 billion euros
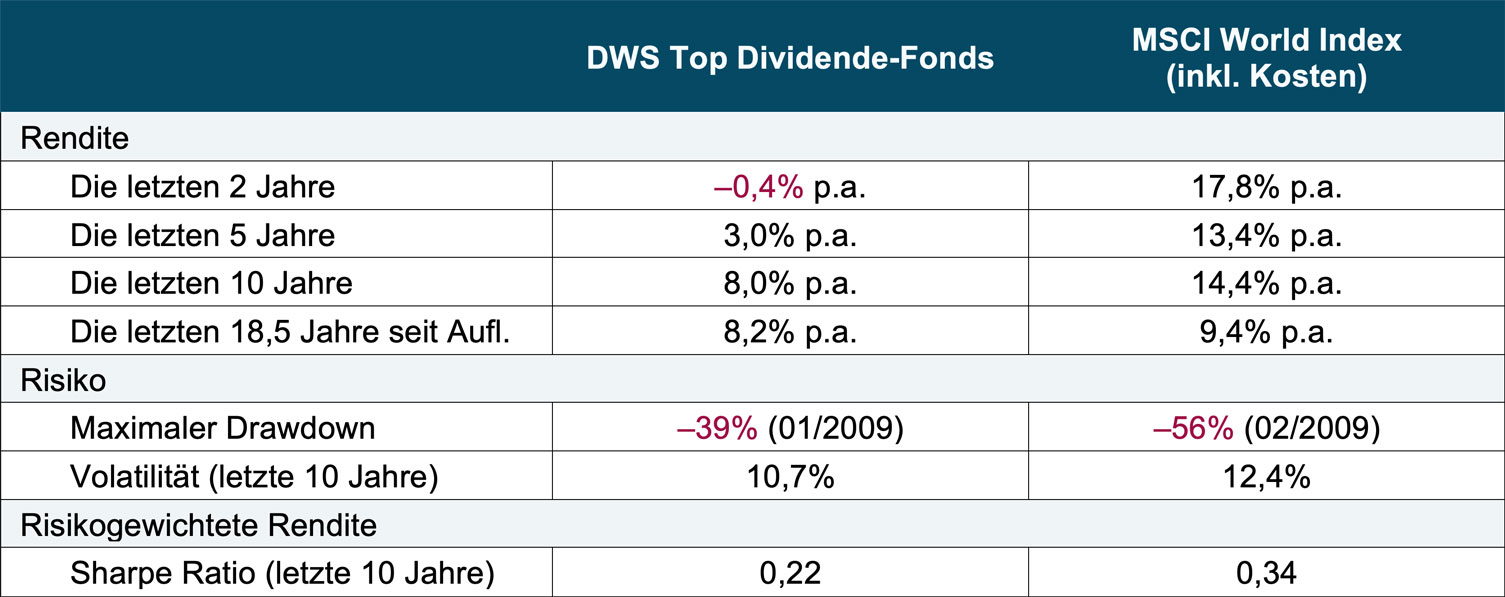
► Calculations in all lines up to the end date September 30, 2021. ► For the fund, the current issue charge was deducted at the beginning of each period. This is particularly effective for short investment periods, e.g. For example, the two and five years shown here have a strong impact on the return. ► The index took into account ongoing costs that were normal for ETFs/index funds in the respective period (higher costs in earlier years, lower costs in later years, in accordance with the actual market development). ► Maximum drawdown = maximum cumulative loss during the observation period. ► Volatility = annualized standard deviation of monthly returns in the 10 years to 09/2021. ► Simple Sharpe Ratio = Arithmetic average of monthly returns over the last 10 years divided by the standard deviation of monthly returns. ► Taxes were not taken into account anywhere.
The table leaves little doubt: Since its establishment in April 2003, the largest German equity fund has drastically underperformed a comparable passive index fund/ETF on a buy-and-hold basis, and the under-return has increased over time. The DWS fund only performs better than the comparison ETF when it comes to risk. However, as the Simple Sharpe Ratio (bottom row of the table) shows, this risk advantage relative to the benchmark was not nearly large enough to compensate for the DWS fund's dismal returns, particularly over the last ten years.
Why is DWS Top Dividende the largest equity fund in Germany despite this modest performance right from the start? Because thousands of customer advisors at Germany's largest bank have been putting it in their customers' portfolios for eighteen and a half years and perhaps because many investors wrongly believe that "dividend-oriented" funds like DWS Top Dividende are somehow particularly profitable - an error that doesn't want to die.
(2) UniGlobal (WKN 849105) – fund company Union Investment – equity fund – fund age 61.8 years – fund volume 10.2 billion euros
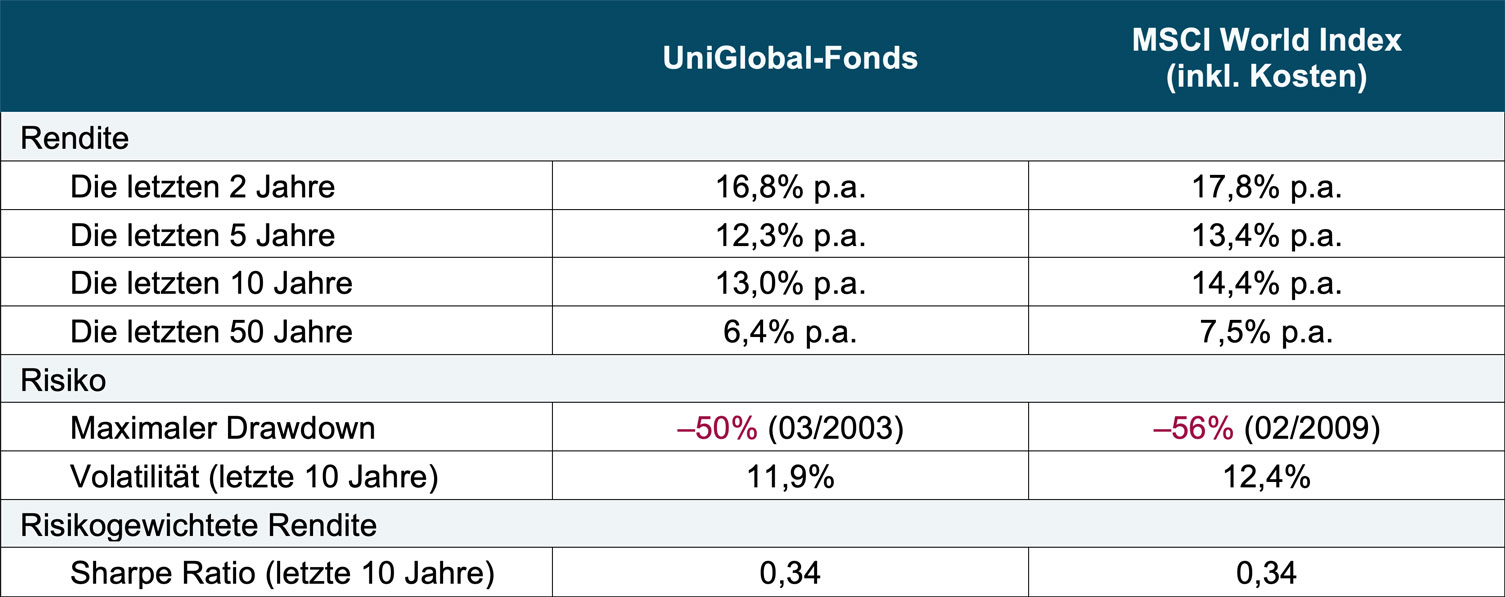
► Calculations in all lines up to the end date September 30, 2021. The UniGlobal issue surcharge of 5% is taken into account. ► For further general explanations, see the table for fund No. 1 (DWS Top Dividend). ► Uniglobal was launched in January 1960. However, the MSCI World Index only goes back to January 1970. Therefore, the “return since the fund was launched” is not shown at UniGlobal, but only the last 50 years.
Investors in UniGlobal can count themselves lucky relative to those in DWS Top Dividende. In the last few decades, UniGlobal investors have only had to suffer the usual market under-return compared to a comparable index fund. Adjusted for risk, at least for the last ten years the performance is the same as that of the ETF (Sharpe Ratio) - although not for longer periods of time (not shown in the table). All in all, UniGlobal appears to be the best fund among our six cases examined - among the blind, the one-eyed man is king.
(3) Templeton Growth (Euro) Fund – A (WKN 941034) – fund company Franklin Templeton – equity fund – fund age 21.2 years – fund volume 7.0 billion euros
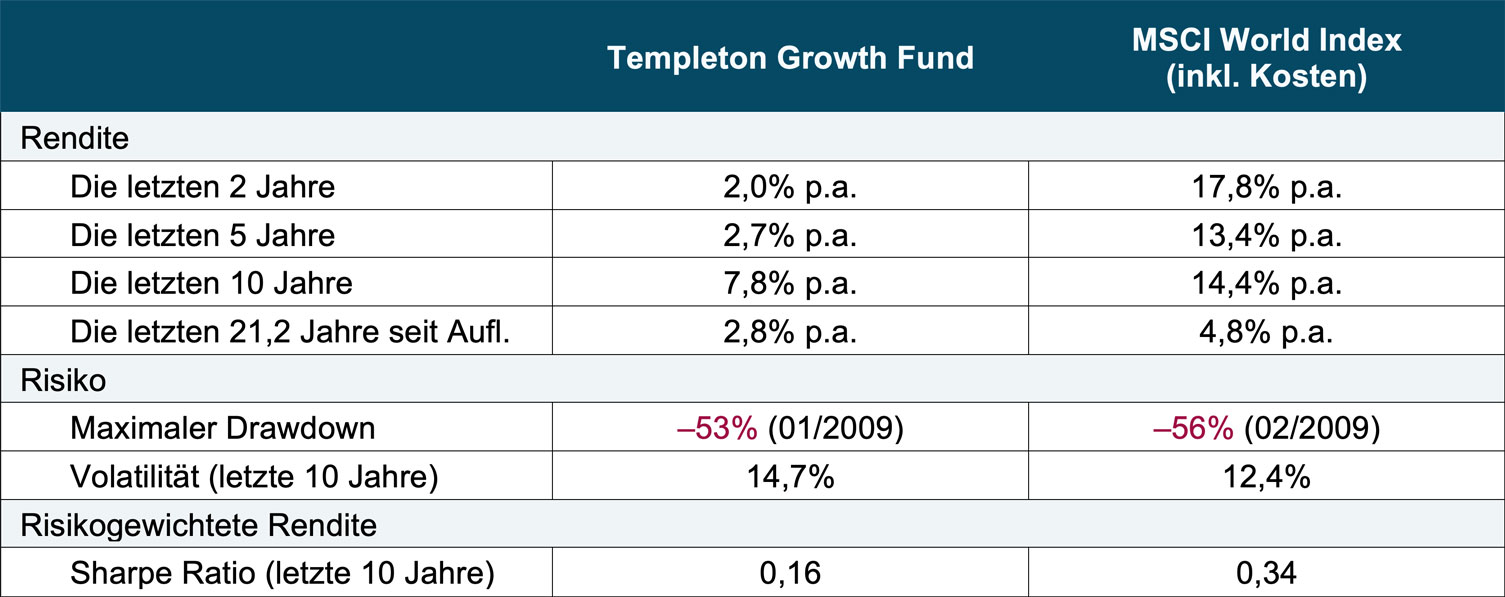
► Calculations in all lines up to the end date September 30, 2021. For the Templeton fund, an issue charge of 5.4% is taken into account. ► For general explanations see table for fund no. 1 (DWS Top Dividend).
Until a few years ago, the Templeton Growth fund had a bizarrely good reputation among financial advisors. The figures listed above illustrate that this was never justified. The consultants and some investors probably confused the US “Templeton Growth Fund” of the same name, which was launched there in 1954, with the European Templeton Growth Fund. The latter was deliberately marketed by Franklin-Templeton as if it were identical to the original US fund. It actually had significantly above-average returns from 1954 to the early 1990s. This outperformance was already history when the new European Templeton Growth fund was established in mid-2000.
Marketing the European Templeton Growth fund as de facto identical to the American Templeton Growth fund was always a steep thesis. For regulatory and tax reasons as well as for operational and pragmatic needs, US investment funds must be managed completely separately from European funds within a fund house, even if they seemingly pursue an identical investment strategy to the outside world. Furthermore, the two funds had different fund managers. John Templeton, the company founder and manager of the US fund, never had anything to do with the fund management of the European Templeton Growth fund. Even the names of the two funds were not identical, just very similar. And last but not least, the Templeton fund company had fundamentally changed anyway as a result of the merger of the two fund houses Templeton and Franklin in 1992 (Franklin was the much larger company).
In any case, Franklin-Templeton thought at the beginning of the noughties that naming the new fund in Europe the same as the legendary, old US fund would have a sales-promoting effect. In this way, marketing could be linked externally to the comparatively high historical returns of the US fund since 1954. The Frankfurt Franklin managers were right, as evidenced by the massive influx of investor money - despite a lack of outperformance from the start. The new fund grew to a peak volume of over 15 billion euros. At some point, however, the rather meager returns could no longer be denied, so the fund volume began to decline. Nevertheless, the fund is still one of the largest in the country today.
Let's now come to the three mixed funds.
(4) Flossbach von Storch Multiple Opportunities – R (WKN A0M430) – fund company Flossbach von Storch – mixed fund – fund age 14.0 years – fund volume 24.7 billion euros
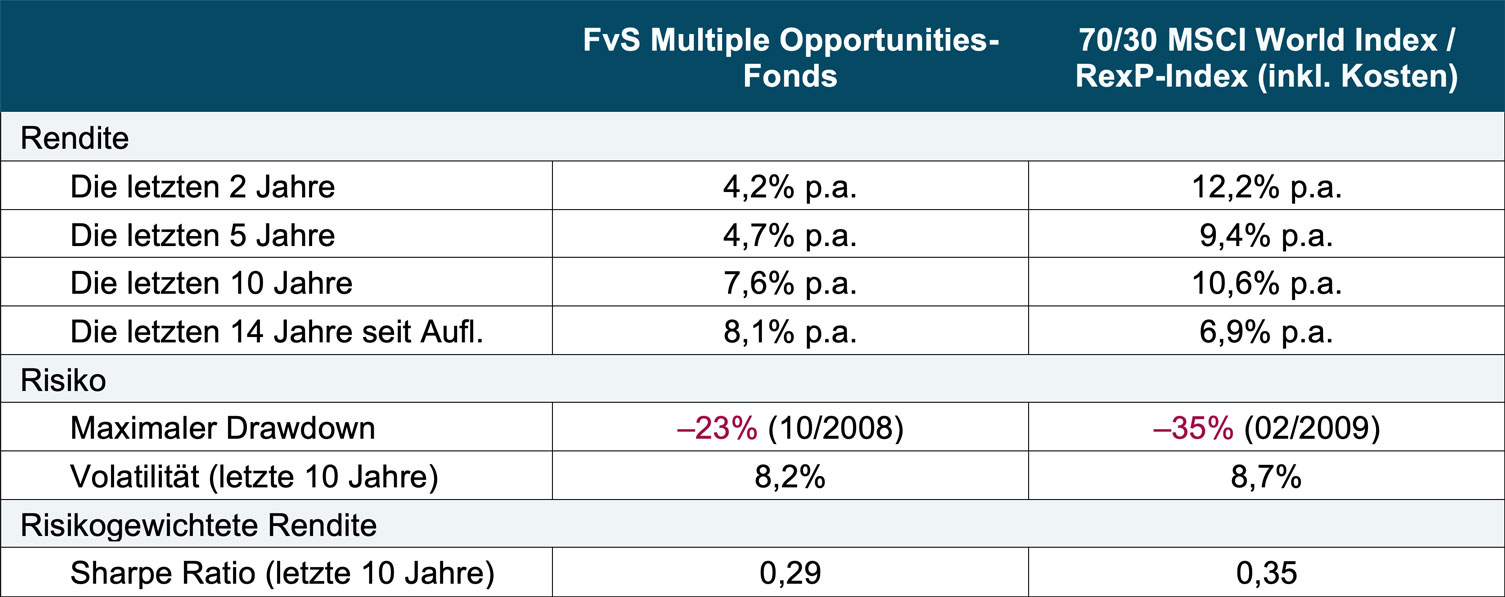
► Calculations in all lines up to the end date September 30, 2021. An issue charge of 5% is taken into account for the FvS fund. ► For further general explanations, see the table for fund No. 1 (DWS Top Dividend). ► The RexP index represents medium-term German government bonds. ► We chose the 70/30 allocation for the benchmark. FvS does not provide any specific benchmark asset allocation in the fund documents. According to the fund fact sheet from September 2021, the fund was invested around 80% in stocks, 10% in gold and 10% in money market investments. Ultimately, even a 60/40 or 50/50 asset allocation in the benchmark would not have led to fundamentally different conclusions than those presented here.
With a fund volume of 24.7 billion euros, the FvS Multiple Opportunities is the largest mixed fund and the largest investment fund in the German market. This makes it clear: Germans like mixed funds. Presumably because they promise “attractive returns with limited risk”. Risk limitation – especially low volatility – always sells well in this country.
Measured by the growth in assets under management, Flossbach von Storch was the most successful German fund company in recent years - primarily through its showpiece FvS Multiple Opportunities.
Of course, as the table shows, this success has been happening more at the level of the fund company and its shareholders than at the level of the fund investors for around ten years.
Indeed, during the first five years of its life from October 2007 to the end of 2012, the Flossbach fund produced phenomenal returns. Then the tide turned. From 2013 to today, the fund has underperformed its benchmark - although not to such an extent that the excellent first five years have been completely offset by a comparative graphical representation or calculation of returns since inception.
When viewed objectively, the last ten years of returns for the Flossbach fund were mediocre compared to a passive benchmark and the last five years were downright limp. Taking the risk into account does not change this conclusion.
Nevertheless, the fund can afford to continue its now anemic performance for a few more years before the "since fund return" falls below the benchmark. For the time being, this key figure, which is important for investors, will remain a wonderful marketing tool. The fund will therefore continue to attract new investor money.
(5) Private fund controlled (WKN A0RPAM) – fund company Union Investment – mixed fund – fund age 11.3 years – fund volume 19.3 billion euros
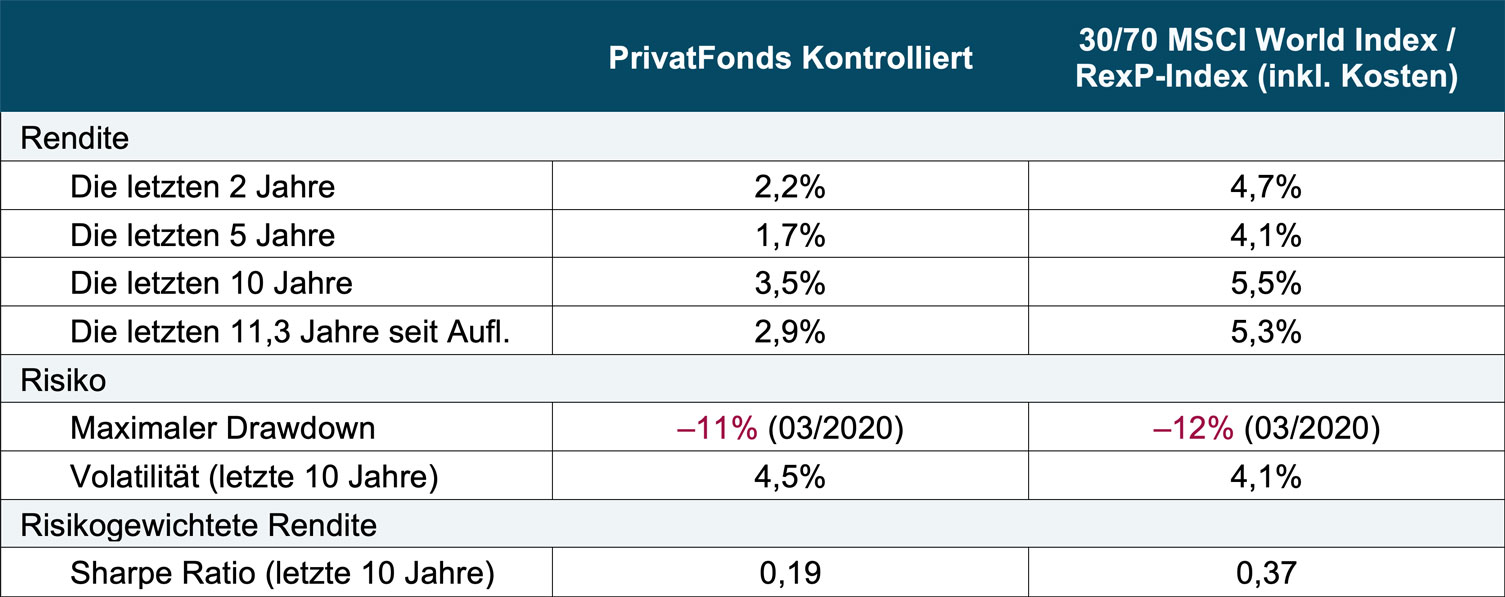
► Calculations in all lines up to the end date September 30, 2021. ► For further general explanations, see the table for fund No. 1 (DWS Top Dividend). ► According to the fact sheet, the fund's goal is to create a portfolio of 30% stocks and 70% bonds.
The PrivatFonds Kontrol (in some databases only “PrivatFonds Kontrol”) is sold almost exclusively to the customers of Volks- and Raiffeisenbanken, or more precisely, placed in the custody account of these customers. (The cooperative banks are the owners of the fund company.) Therefore, despite its enormous size, the fund with the strangely old-fashioned name is hardly known outside the clientele of the 800 Volks- und Raiffeisenbanken in Germany.
Our table makes one thing clear: the fund's performance cannot have caused its success with the public. Since the fund was founded in July 2010, the relative return has been underground. With roughly the same risk as the ETF benchmark, the fund only produced half the return. What else can you say about that?
Let's move on to the last fund in our six-pack of German flagship funds.
(6) Carmignac Portfolio Patrimoine A EUR (WKN A0DPW0) – fund company Carmignac Gestion – mixed fund – fund age 32.0 years – fund volume 10.9 billion euros
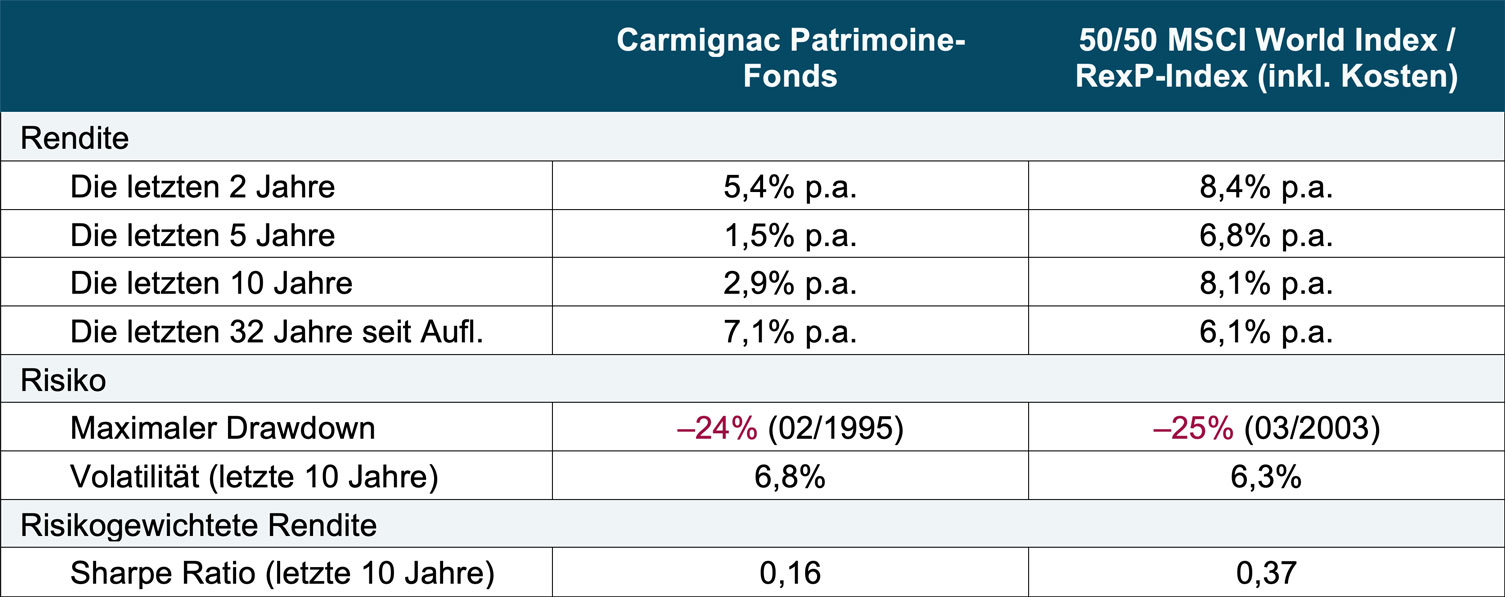
► Calculations in all lines up to the end date September 30, 2021. An issue charge of 4% is taken into account for the Carmignac fund. ► For further general explanations, see the table for fund No. 1 (DWS Top Dividend). ► According to the fact sheet, the fund considers a portfolio of 50% stocks and 50% bonds as a benchmark.
There was a time when Germans and French loved the Carmignac Patrimoine mixed fund like no other. In 2013 - around 20 years after its founding at the end of 1989 - the fund, which is sold primarily in France and Germany, had grown to an incredible volume of over 30 billion euros. At this point, he had long passed his peak returns. However, the fund was still able to score points with the public and the media in purely mathematical terms with an attractive return since the fund was launched. It was and is to this day higher than the ETF benchmark because Carmignac had four spectacular years at the very beginning. With the impressive returns since the company was founded, it was possible to collect customer money excellently for the first 20 years, even if later customers of course had no more of it. After 20 years, such a “historical myth” simply no longer appeals to audiences. The “moderate” fund returns after 2013 led to a large outflow of funds.
Conclusion
In this blog post we looked at the return and risk of six of the largest actively managed investment funds in Germany. In none of the six cases is the return-risk combination truly presentable relative to a buy-and-hold ETF benchmark over the past decade, and in some cases it is disastrously poor.
This corresponds to the pattern that has been confirmed many times in science over the past 60 years: 90% of all actively managed investment funds are below a correctly selected passive benchmark for periods of 5+ years. The longer the observation period, the closer the under-return rate approaches 100%.
Why are the six funds in Germany analyzed here still the largest of their kind despite lukewarm returns over the past decade or more? Either because they are maneuvered into the portfolios of gullible customers by a banking group - lukewarm returns or not - or because these funds generated strong outperformance in the first few years after they were founded, from which they continued to benefit for ten to 15 years afterwards via the "return since inception" key figure when collecting customer money. Real performance in recent years was not the cause of the fund's popularity in any of the six cases.
Endnotes
[1] “Investment funds” are referred to here as “public funds”, i.e. funds intended for distribution to private investors (in regulatory terms “UCITS funds”). This does not include special funds, hedge funds, private equity funds, pension funds, sovereign wealth funds and other institutional funds.