
From Gerd Kommer and Jonas Schweizer
Although residential real estate is the largest and oldest asset class in the world, there is more to its history Return a surprising lack of clarity. From the perspective of a private investor, this blog post aims to shed light on this return darkness. We addressed the parallel topic of the risk of direct investments in residential real estate separately in our blog post from August 2018 with the title “Better understand the risk of direct investments in real estate“ deals with.
Anyone who wants to invest money should have an idea of the future returns of the investment alternatives available to choose from. For rational savers or investors, such ideas start with asset class returns. [1] In economics, forward-looking estimates of asset class returns are derived from the long-term past. This applies to stocks, interest-bearing investments, raw materials, precious metals and collectibles and should actually also apply to real estate. Of course, “deriving from the past” does not mean simply mindlessly extrapolating the long-term historical average return into the future. However, it does mean that a serious estimate of expected asset class returns is impossible without a meaningful comparison with asset class returns going back far into the past - the last ten or 20 years are certainly not enough. When it comes to stocks and interest-bearing investments, this observation is actually trivial. This blog post will shed light on what real estate looks like.
Over the last two decades in particular, economists have often painstakingly compiled high-quality return data for stocks, interest-bearing investments and raw materials for around 20 Western countries, going back to 1900, i.e. almost 120 years. It should be emphasized that this data covers a variety of different political and economic crisis phases as well as upswing phases and is therefore more meaningful and representative of the future than just the recent past. The three London finance professors Elroy Dimson, Paul Marsh and Mike Staunton were particularly deserving of this. They are probably the world's leading experts on historical, cross-country comparable return time series.
In the 2018 edition of their annually updated, highly regarded “Investment Returns Yearbook”, Dimson, Marsh, Staunton (“DMS”) for the first time comprehensively deals with the returns on residential property in the period from 1900 to 2017 (118 years). In their analysis, the three data experts confirm the well-known, fundamental shortcoming that exists with regard to the residential real estate asset class: reliable, internationally comparable GtotalResidential real estate returns that go back further than 10 or 20 years are virtually non-existent for the world's largest asset class. The data situation for the USA and Great Britain is slightly better than for the rest of the world, but there is also a lack of generally accepted, consistent data in the Anglo-Saxon countries Total returndata series that go back more than ten or more than 20 years. So nothing from which one could derive robust insights for the future. (The data situation for commercial properties such as offices, retail, hospitality and industrial properties is even worse than that for residential properties.)
In the previous paragraph the emphasis was on In totalreturns. Mere residential property price increase data for a good dozen Western countries - including German-speaking countries - is of course available, although these data series are of poor quality for many countries, especially in the first half of the 20th century.
The price increases (increases in value) expressed in real estate indices represent only a part of the total return on real estate. What is missing are the net rental yields, i.e. gross rental income minus maintenance costs and insurance costs. Therefore, the publicly known real estate indices such as: B. the Bulwiengesa index for German residential properties for assessing the In totalreturn is almost useless - just as a pure price increase index for stocks is useless when it comes to calculating the total return of stocks because it does not take dividends into account. More than a third of the historical return on stocks comes from dividends and these are only included in a performance or total return index (such as the DAX), but not in a price or price index. For real estate, the gap between price and total return indices tends to be even greater than for stock indices. However, almost all real estate indices are pure price indices. A few national total return indices for residential real estate exist, but only for the last decade or two.
Figure 1 illustrates how residential real estate moves from pure appreciation to total return and the availability of historical data related to the four main components of total return.
Figure 1: The relationship between appreciation and total return on real estate and the availability of historical data series

► Source: Own illustration. ► (1) For an owner-occupied residential property, the gross rental yield results from the rent saved. ► (2) The total return in this schematic representation does not include any purchase/sale costs, any leverage costs (credit costs) and no tax effects.
If you want to determine historical total returns for residential properties, you have to estimate the return components of gross rental yields, maintenance costs and insurance costs. This is problem number 1. Since property price indices are also known to contain systematic distortions that tend to exaggerate the increases in value shown, one must try to correct these distortions in the data - problem number 2. Only through these corrections can a reliable data basis be created, which is the starting point on the tricky route to total returns. DMS made these estimates and corrections in their aforementioned yearbook.
Figure 2 below comes from the DMS Yearbook and shows how one can gradually move from historical price increases from eleven national real estate indices (the countries with the best data quality) to a historical total return figure for the residential real estate asset class. However, the estimate of the gross rental yield in the bar on the far right comes from us (GKI), as DMS deals with gross rental estimates from other authors in their publication, but does not commit to their own number. How we arrive at our estimate of 4.5% and how we validate it can be found in the notes below the figure.
Figure 2: Residential real estate: From inflation-adjusted historical price returns gradually to total returns (average of eleven Western countries)
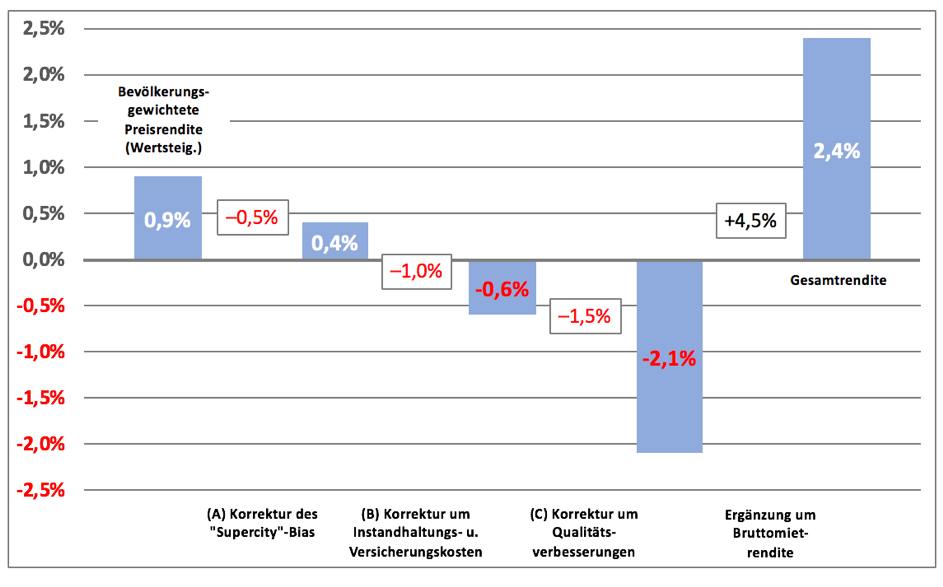
► Source: Dimson, Marsh, Staunton, 2018b, p. 78. The gross rental yield estimate of 4.5% added to the bar on the far right comes from Gerd Kommer Invest GmbH. The number is based on information from the literature and historical data series: For the period from 1975 to 2017, the real estate service provider Bulwiengesa determined an average gross rental yield of 3.9% p.a. for “new condominiums” (new rentals) in Germany. a. It can be assumed that this number would be lower for existing apartments. The US research institute Lincoln Institute of Land Policy estimates an average gross rental yield of 4.9% p.a. for owner-occupied residential properties in the USA from 1960 to 2016. a. However, the USA has a particularly high property tax (over 1% p.a. in most states compared to less than 0.1% p.a. in Germany). This high tax could contribute to the higher gross rental yield. ► Excluding transaction costs (purchase/sale), excluding any credit costs, excluding taxes. ► The eleven countries underlying the leftmost bar are those for which DMS found minimum sufficient data reliability. DE and AT are not included due to insufficient data quality.
What are the reasons for the DMS adjustments (A), (B), and (C) to the historical price index data? Regarding (A) “Supercity Bias”: Especially for the first half of the 20th century, many national real estate price indices are based only on data from the capital or the two or three largest cities. If these cities had higher population growth than the rest of the country, then property prices there are expected to have increased 0.5 percentage points faster, estimated by DMS. Regarding (B) “Maintenance and insurance”: Real estate indices do not take maintenance and insurance costs into account. In our opinion, the value that DMS sets for this (1.0%) is too low. More realistic would be 1.5% to 1.7% of the building value, which in the standard case makes up 80% to 90% of a residential property (see e.g. here). Regarding (C) “Quality adjustment”: Real estate indices generally do not contain any correction for the increases in value that arise over the years and decades due to larger and higher quality properties whose price data are included in the index. However, price increases that result solely from these increases in quality are not real price increases that would have occurred in a typical, real property without additional investment costs. In order to bring real existing properties into line with the values in the index, all other things being equal, according to DMS, money would have to be spent at around 1.5% p.a. a. be expended. Conversely, you have to pay this 1.5% p.a. a. deduct from the index in order to arrive at the performance of actually existing properties.
Table 1 shows how the historical total return of the “residential real estate” asset class determined in this way compares with the return of other main asset classes.
Table 1: Comparison of historical total returns of the most important asset classes from 1900 to 2017 (118 years) - adjusted for inflation

► Before costs and taxes. ► Data sources: For residential properties see Figure 2; Capital market returns: Dimson, Marsh, Staunton 2018a; Gold: World Gold Council; Raw materials: David S. Jacks. ► (1) See Figure 2. ► (2) One-Month Treasury Bills (very short-term US government bonds). ► (3) Raw materials include the five main raw material groups: energy, precious metals, base metals, minerals and agricultural raw materials.
Based on the available data, the DMS corrections and our gross rental yield estimate, residential real estate has historically had an inflation-adjusted total return quite significantly below that of equities and slightly above that of long-term government bonds.
Since the majority of all residential properties are initially financed in part with loans, the question arises as to whether taking the leverage effect into account when calculating the return on equity of residential property investments would significantly increase the return figure for residential properties in Table 1. Probably not. Historical calculations for the USA, the Netherlands and Germany for the past four decades indicate that debt capital tended to be detrimental to returns over the entire period under review (Kommer 2021). There is a parallel here with stocks: There, too, no systematic positive impact on shareholder returns from increasing the debt capital ratio at company level can be determined (see here).
Finally, we will look at a recently published study by a group of economists that aims to prove that, on average, residential real estate in 16 Western countries from 1871 to 2015 (144 years) had higher returns with lower risk than stocks (Jordà et al. 2019). The study has the somewhat embarrassing title “The Rate of Return on Everything.” We looked at it intensively and came to the same conclusion as Dimson, Marsh, Staunton 2018, who also did the same: The central result in the study - the determined return and risk of the residential real estate asset class - is very likely wrong. The return results for real estate are partly based on raw data of unacceptably low quality. Historical rental yields (since they only exist for the recent past) are easily estimated using strange methods. The results - although contradictory to mainstream research - are not compared with the established literature. Corrections for the already mentioned distortions in the historical price increase data (quality improvements, supercity bias) are completely missing or too small. Transaction costs (between ten and 100 times higher for real estate than for securities) are not sufficiently taken into account. The methodical approach that produces lower risk for real estate than for stocks is “courageous”. In reality, direct investments in one or more residential properties have as much, perhaps more, risk than a globally diversified stock investment, as we wrote in our recent blog post entitled “Better understand the risk of direct investments in real estate(Perhaps still interesting: within the 16 countries examined, Germany was “at the bottom” in terms of returns.)
Conclusion
- The data quality of historical total returns for residential real estate is weak. The lack of high-quality, long-standing data should be cause for particular skepticism with regard to the traditionally exaggerated promises made by the banking industry, the real estate industry and - in recent years - also by a considerable number of real estate bloggers. This insight seems important, especially at a time when real estate returns over the past nine years have been spectacularly above average.
- Available data suggests that historical returns from residential real estate are below equities and slightly above government bonds. We believe this will continue to be the case in the long-term future. Of course, individual time windows - even time windows of ten years, for example - will deviate greatly from the long-term average. This applied and applies to all asset classes.
- Historically, leverage has not been a reliable means of systematically increasing the returns on equity of real estate investments; not from risk and even less after risk. The often unbalanced emphasis on the possible positive return effects of leverage in the real estate industry should be cause for concern.
Endnotes
[1] An asset class is a logically sensible grouping of assets with a similar or identical return-risk combination. Examples of asset classes: cash, fixed income, equities, commodities, precious metals and real estate.
literature
Dimson, Elroy /Marsh, Paul /Staunton, Mike (2018b): “Credit Suisse Global Investment Returns Yearbook 2018″; Long Version; Credit Suisse Research Institute; 251 pages.
Jordà, Oscar / Knoll, Katharina / Dmitry Kuvshinov / Moritz Schularick / Alan Taylor (2017): The Rate of Return on Everything, 1870-2015"; December 2017; Internet reference: here
Kommer, Gerd (2018): “Invest confidently with index funds and ETFs. How to win the game against the financial industry”; Campus Publishing; 5th edition; March 2018; 416 pages.
Kommer, Gerd (2021): “Buy or rent – How to make the right decision for yourself”; Campus Publishing; 3rd edition; 2021; 285 pages.
Kommer, Gerd (2022): "Real estate financing for owner-occupiers: Save money and avoid mistakes when buying your own four walls; Campus Verlag; 2nd edition; 2022; 315 pages.
Kommer, Gerd / Schweizer, Jonas (2018): “Better understanding the risk of direct investments in real estate”; Financial blog August 2018; Internet reference: here
Kommer, Gerd/Schweizer, Jonas (2021): “Maintenance costs – how to gloss over real estate investments”; May 2021; blog post; Internet reference: here