
<<< This blog post is also available as a YouTube video. >>>
From Gerd Kommer and Felix Großmann
The title of this blog post is shameless clickbait. There is no such thing as the best stock in the world because the criteria for “the best stock” cannot be meaningfully defined. Instead of the “best” stock in the world, you would just try that most profitable To choose from the many hundreds of thousands that have existed in the last 100 years, you would first have to decide on the question of the period under consideration. The winning stock would be different for almost every interval from one year to 50 years. In addition to mere profitability, one would also have to take the associated risk into account.
Nevertheless, looking at the world's most profitable stocks in the long term has insight value, as we show in this blog post.
We arbitrarily limit ourselves to stocks that are alive today and only consider those that have been around for at least 34 years. Why 34 years? We wanted, firstly, a 30+ year period and, secondly, Microsoft had its IPO 34 years ago. Microsoft is one of very few “superstar stocks” – understood here as stocks whose return over 30+ years is at least twice as high as that of the market as a whole.
However, our real focus in this blog post is not on Microsoft, but on Apple. Apple shares are probably most often mentioned by private investors as an answer to the following question: “Which well-known share do you think had the highest return worldwide over the last 30 years?”
Before we get into the return numbers, we can confirm: Yes, Apple has been a phenomenally profitable investment over the past four decades, probably one of the most profitable stocks in the world, but that's only half the story. We want to tell you the other half below because it contains a number of useful insights for private investors.
First, a few statistics on the size and structure of the world stock market: There are currently around 9,500 large, mid and small caps and around 40,000 micro caps worldwide. The latter are so small that “no one” outside the company’s immediate environment and customer circle knows them. In addition, micro-caps are very illiquid and incur high transaction costs when buying and selling. The well-known MSCI World Standard Index includes around 1,600 largest stocks from 23 industrialized countries, which corresponds to around 75% of the market capitalization of all stocks globally. According to a rough estimate, over 85% of all publicly traded companies that were listed on any stock exchange worldwide at some point in the past 100 years have disappeared today; disappeared mainly via bankruptcy, “de-listing” or being bought out by another company. At any given time, 99% of all companies on the planet are not listed on the stock exchange, although on average the listed ones are much larger.
And finally, a methodological note: What we are doing in this blog post is not just clickbaiting with its headline, but also blatant “data mining” by in retrospect choose one of the best stock investments in the world - just as if it had been possible 39 years ago with the Apple IPO, this miracle investment was reliable ex ante to identify. Of course it wasn't. Recognizing such a later prodigy stock during an IPO three or four decades ago, concentrating all your money or at least a significant portion of it in it and not selling it for 30+ years, this feat is achieved - we believe - less often than six numbers in the lottery.
But first, let's illustrate in Table 1 how surreally high the long-term returns of three superstar stocks - Apple, Microsoft and Berkshire Hathaway (Warren Buffett's company and investment vehicle) - have been over the past few decades.
Table 1: Inflation-adjusted (real) returns of three superstar stocks compared to the general US stock market and the risk-free return (“savings account return”) – excluding costs and taxes, in USD
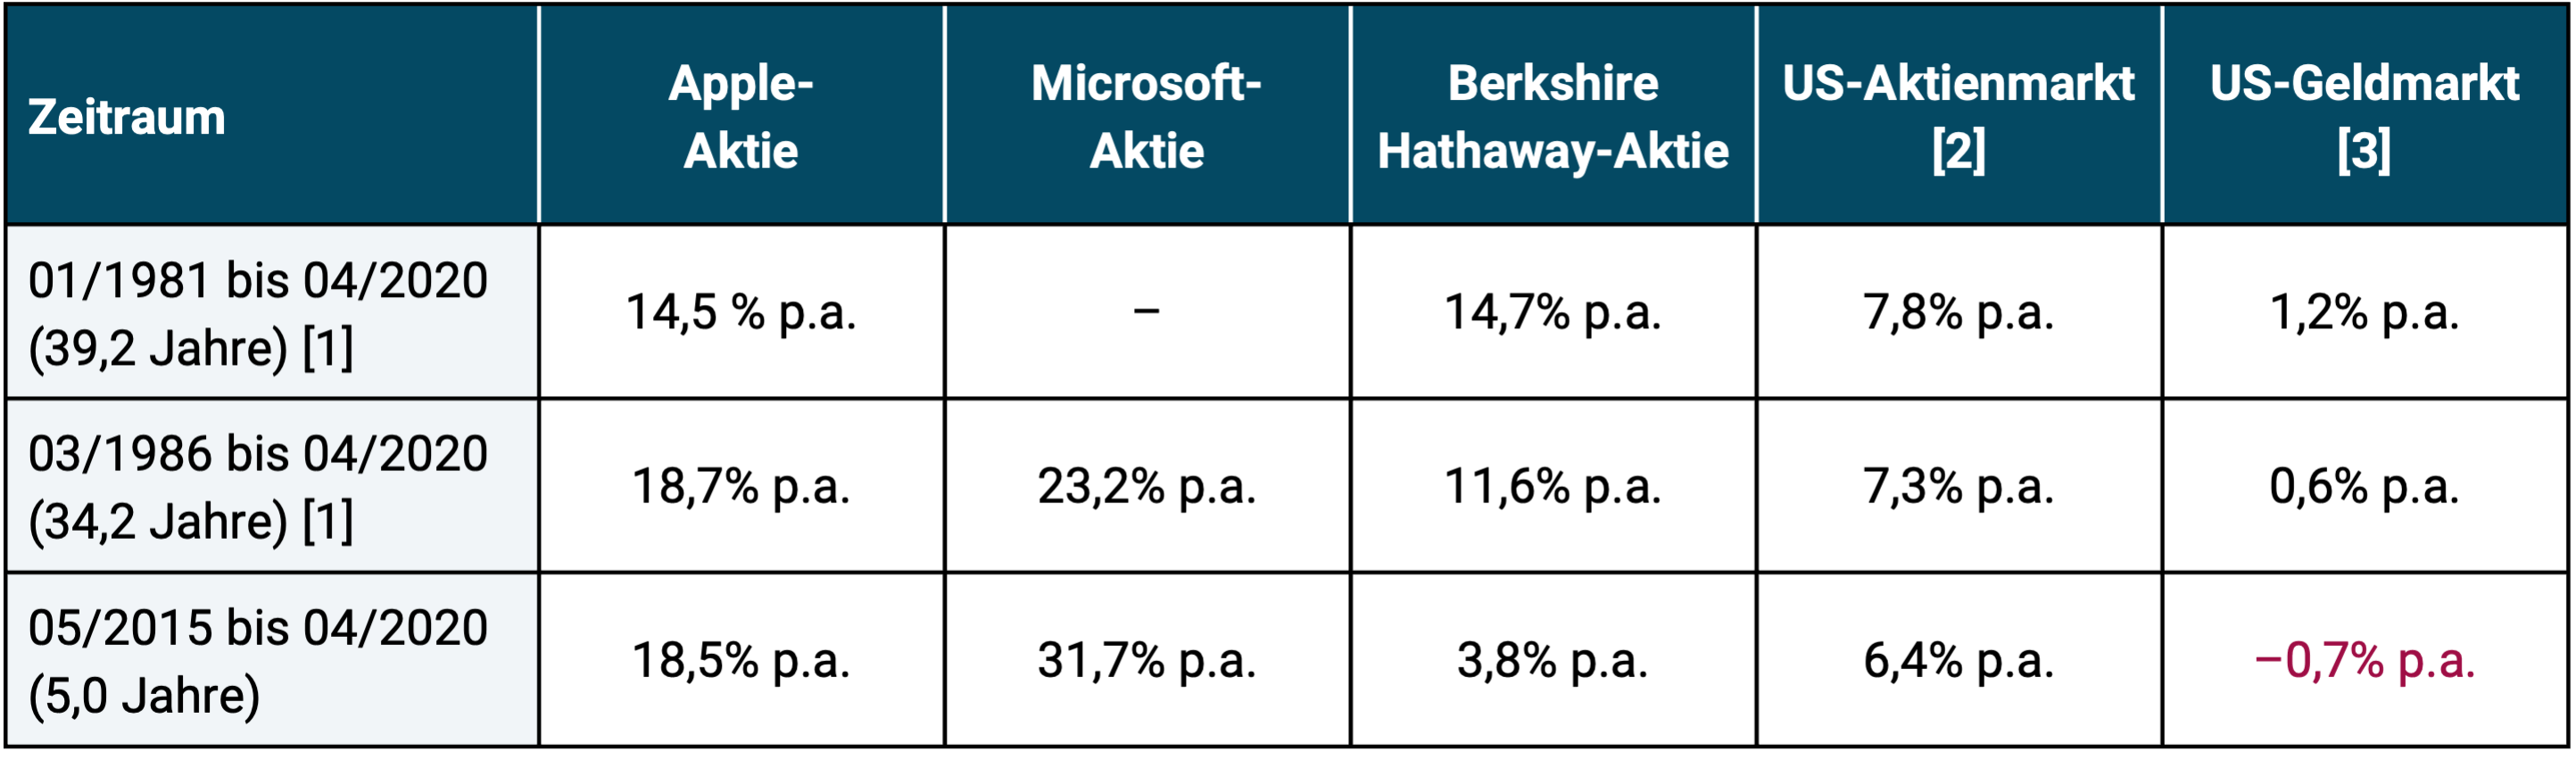
► Return = real geometric annual average return including dividends. ► [1] Apple was listed (listed on the stock exchange) in December 1980, Microsoft in March 1986. ► [2] US stock market: CRSP 1-10 index (US total market); the S&P 500 index would have had slightly different returns. ► [3] US money market (“savings book yield”): One Month US Treasury Bills. ►From 1965 to 2019 (55 years), Berkshire outperformed the S&P 500 stock index with a real gain of 15.8% p.a. compared to 5.9% p.a. ► Data sources: Yahoo.com, Dimensional Fund Advisors, Berkshire Hathaway.
What are the main conclusions that can be drawn from Table 1?
- Apple was narrowly beaten in terms of returns by Berkshire over the longer period (39 years) and by Microsoft quite clearly over the two shorter periods (34 years and 5 years) - this may come as a surprise to some Apple fans.
- The superstar stock Berkshire Hathaway has underperformed the general US stock market over the last five and ten years (ten years are not shown here).
- What do the Superstar Returns percentages mean in monetary units? If an investor were to invest 10,000 euros today with an average real return of 14.5% p.a., he would have built up the final assets of 2.03 million euros with this relatively moderate starting sum after 39.2 years - in today's purchasing power, mind you (it would be significantly more including inflation). This corresponds to a cumulative return of over 20,000%. In the overall stock market that would have been “only” 190,000 euros (cumulative return 1,800%). If you realistically deduct a tenth of these returns for costs and taxes, the final asset value for Apple shares would still be an impressive 1.23 million euros (cumulative return of around 12,000%) compared to “only” 143,000 euros for the overall stock market (1,330%). The big difference is - not surprisingly - the strong compound interest effect over long periods of time.
- With the savings book return, before taxes and costs, you would increase 10,000 euros after almost four decades to a paltry 15,000 euros (after taxes and costs, even less). This confirms the statement that we have been publishing again and again for years [see also our blog post “Zero interest rates and investment shortages – real or just constructed?”]: In the last 120 years, it has never been possible to build wealth with “risk-free” investments in the sense of “zero volatility” after inflation, taxes and costs. In this sense, there have always been “zero interest rates” worldwide. Anyone who describes zero interest rates for “risk-free investments” or bank deposits as something new and a phenomenon caused by the ECB or other central banks should put on a fool’s hat.
But let's get to the most important part of this blog post, the risk, i.e. the "pain" that a private investor had to endure if he actually wanted to reap the superstar returns of Apple shares. Table 2 illustrates that this pain was immense relative to the broader market.
Table 2: Apple Stock: Maximum Drawdown and Other Risk Metrics Compared to Overall U.S. Stock Market Based on Real Returns, in USD
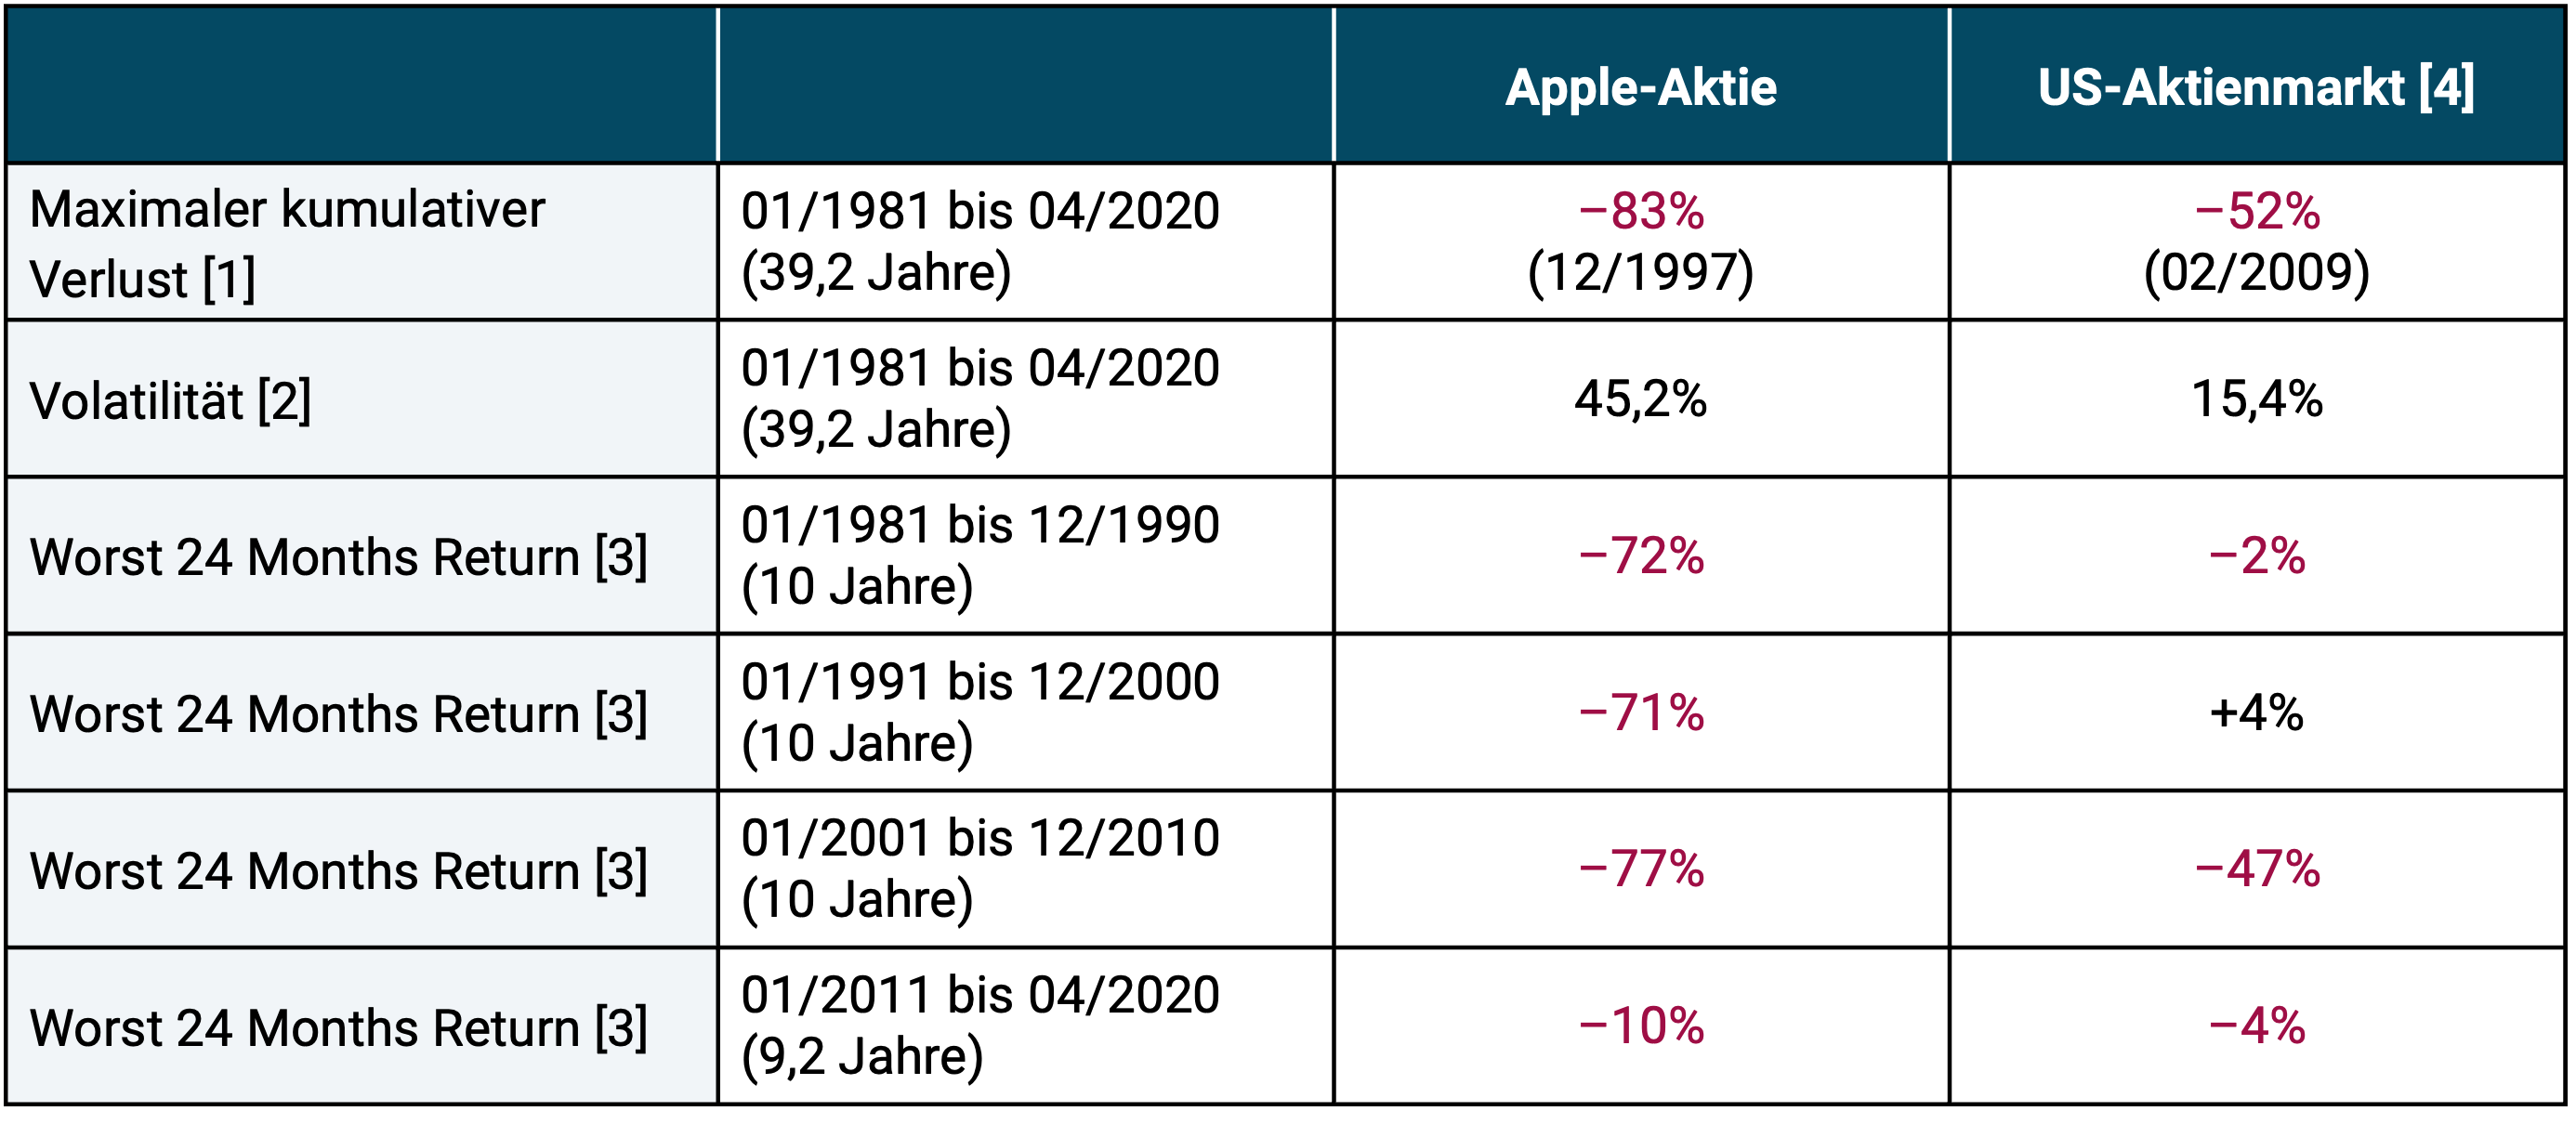
► [1] Maximum cumulative loss (maximum drawdown) over the entire period. ► [2] Volatility: Annualized standard deviation of monthly returns. ► [3] Worst 24 Months = highest cumulative 24 month loss in the specified period. ► [4] CRSP 1-10 Index = entire US stock market.
What are the main conclusions that can be drawn from Table 2?
Apple shares were orders of magnitude more profitable than the broader stock market during their 39-year existence, but at the same time they were also immensely riskier over the entire 39-year period. Their ongoing return fluctuations (volatility) were three times higher. When it comes to the other risk metrics reported, Apple has performed even worse compared to the overall market in some decades.
In each of the four decades of Apple's life and suffering, Apple shareholders have had to endure brutal blows in the neck compared to the overall market in the form of repeated double-digit price drawdowns - and particularly severe ones in the first 20 years. In English, the associated nervous-emotional rollercoaster ride is expressed very vividly as “gut-wrenching”. And with an individual stock – unlike the global stock market – you know after a sharp drop not sure that it will go up again at some point.
A normal private investor will not be able to endure this mental torture for two and a half decades, except perhaps if only a fraction of his assets are invested in the stock. That's why, to our knowledge, there is not a single private investor in the world who has held any significant position in Apple for the full 39 years of Apple's life. [1]
A picture says more than a thousand words. We therefore show the development of Apple shares since the Apple IPO at the end of 1980 until today in a graphic (Figure 1) and contrast this development with that of the entire US stock market.
Figure 1: Growth of Apple stock and the overall US stock market from January 1981 to April 2020 (39.2 years) based on real returns, excluding costs and taxes, in USD (logarithmic vertical scale) - indexed
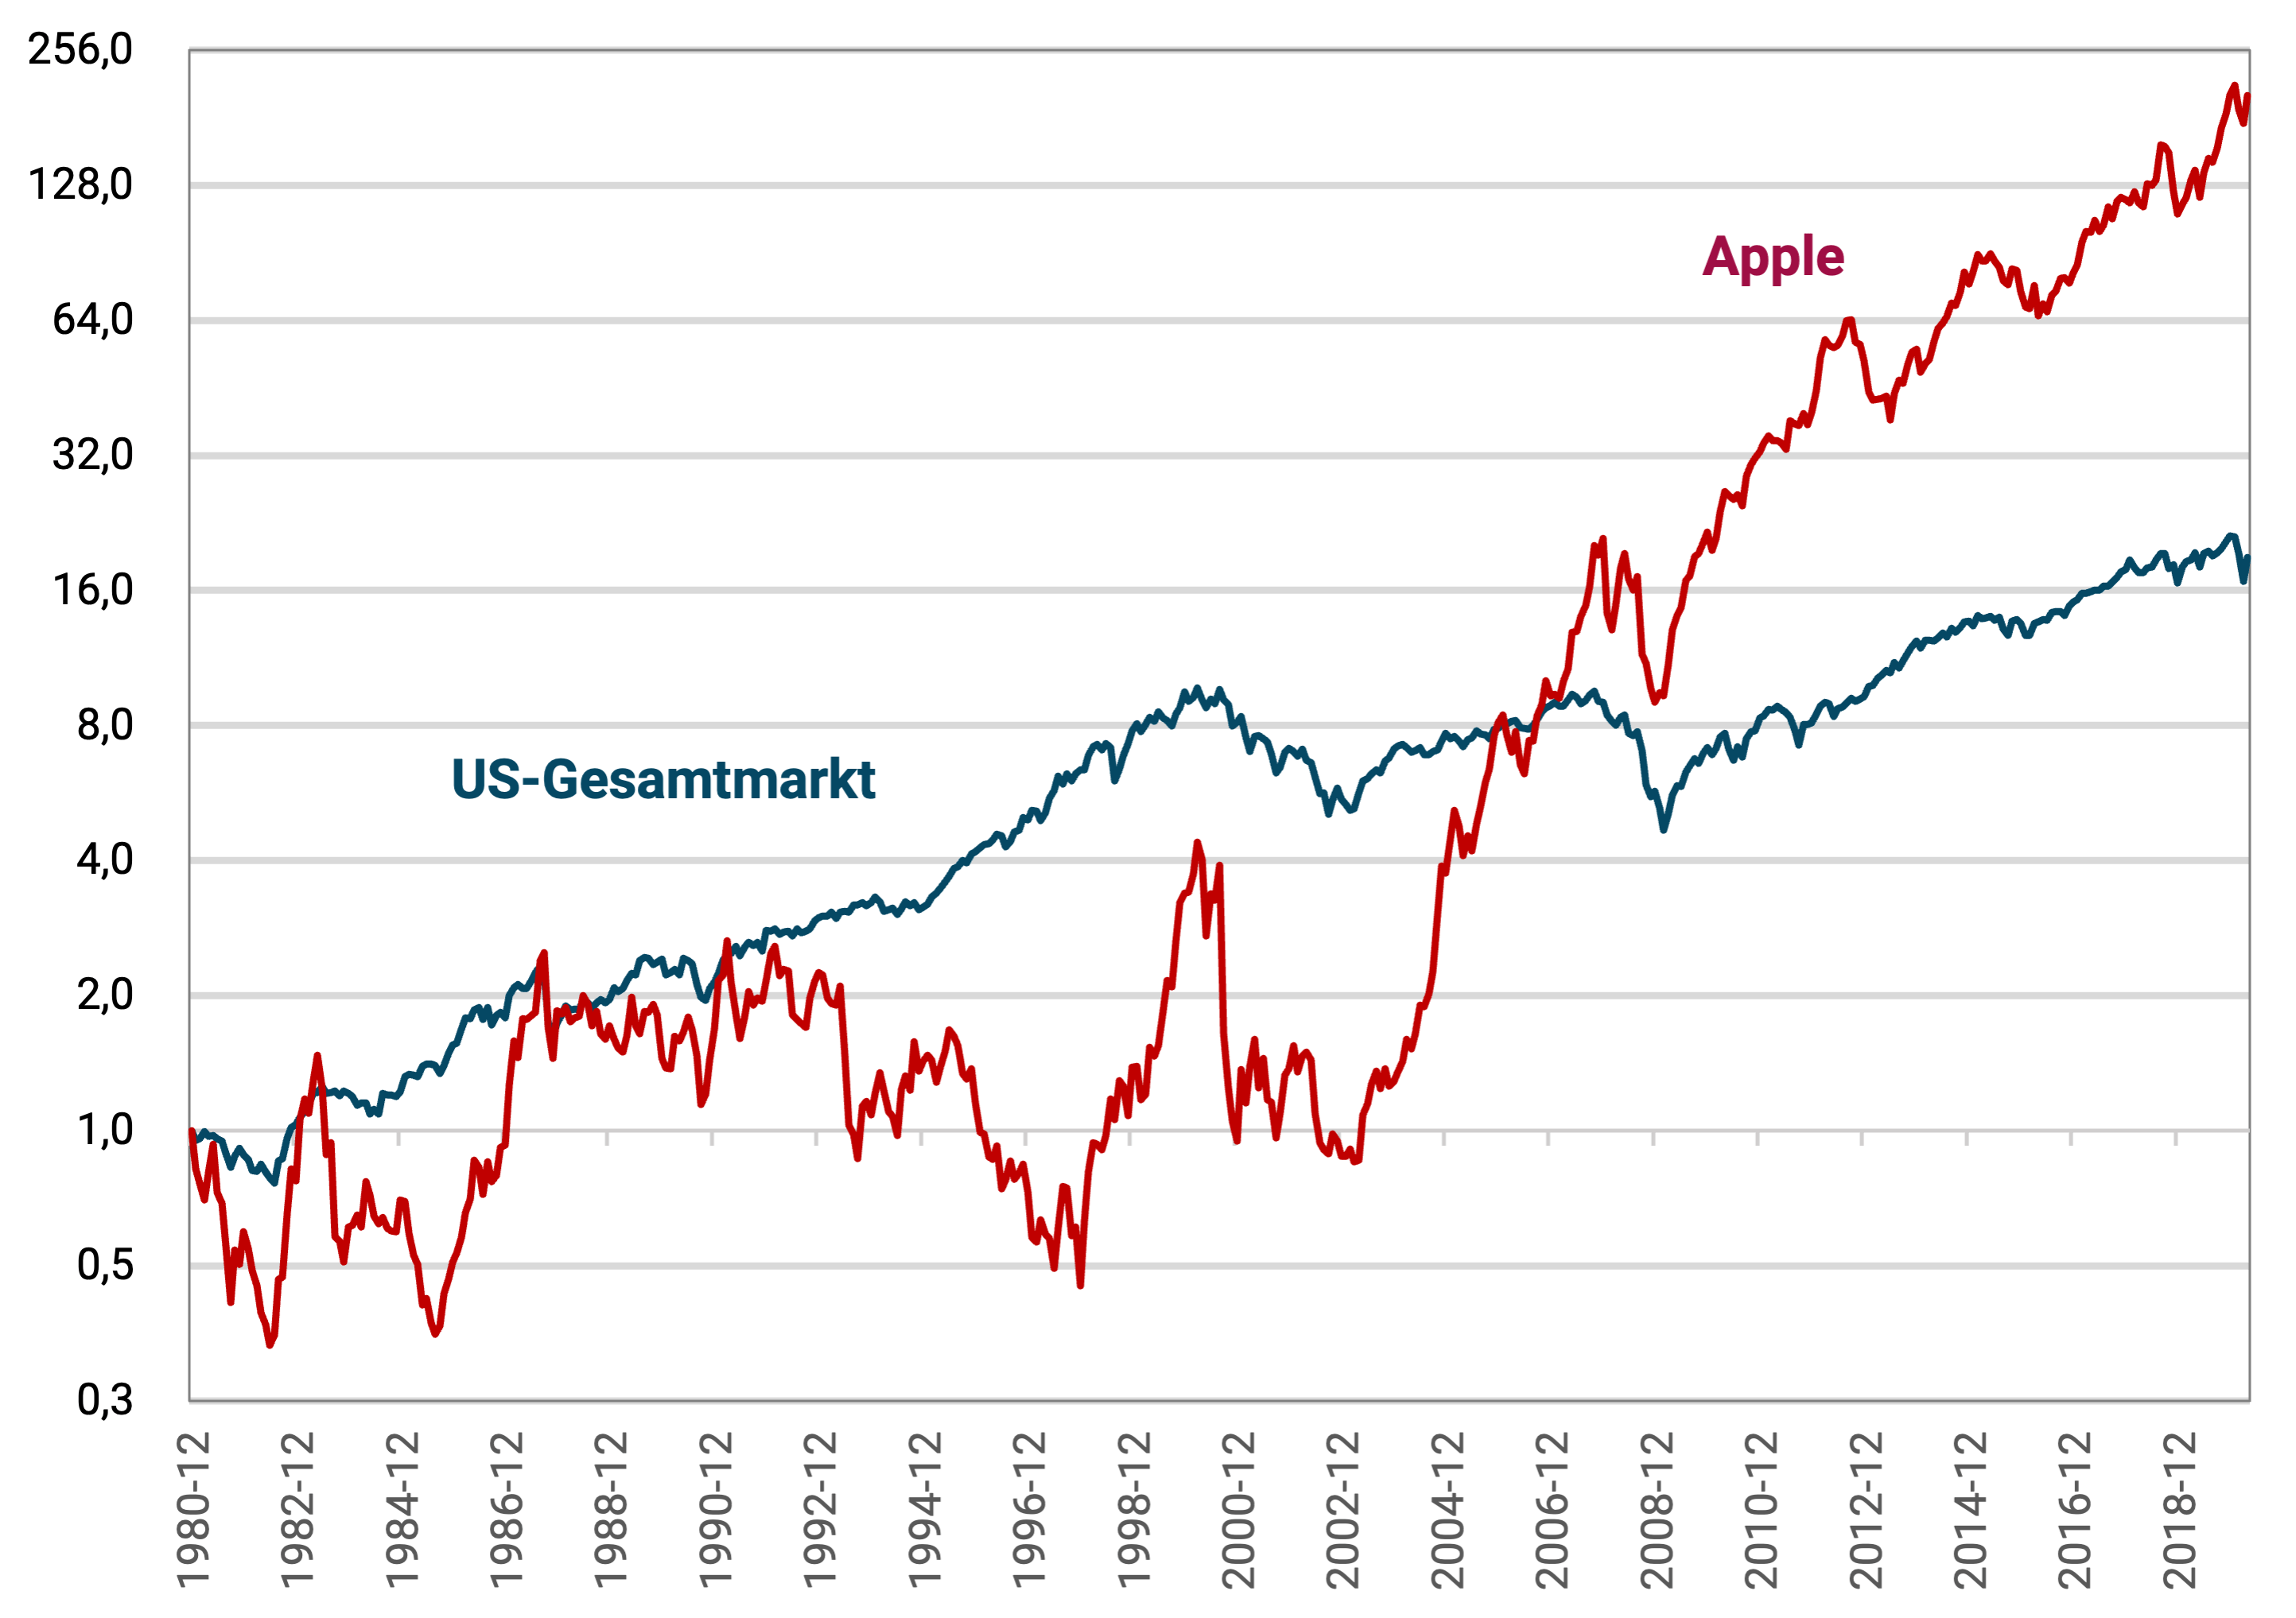
► [1] US overall market: CRSP 1-10 index. ► [2] The logarithmic vertical axis was chosen so that the percentage changes over the entire 39-year period are visually easily comparable. This would not be the case with a normal arithmetic scale.
What can be seen from the figure?
- You don't have to be a statistics professor to realize that in the mountaineering world, the red curve (Apple) is equivalent to climbing an eight-thousander in particularly bad weather; The blue curve (overall stock market), on the other hand, is more like a moderately difficult amateur mountaineering tour to Mont Blanc (4,800 meters) in normal weather.
- Apple produced zero real returns for its shareholders over the first 22.5 years of its existence (January 1981 to May 2003) - without taking costs and taxes into account. During this time, an alternative investment in a total market index fund had increased sixfold in real terms.
- Over the first 25.8 years of Apple's existence (January 1981 to September 2006), the stock only achieved the return of the general stock market - with three times the volatility risk.
Yes, an initial dollar invested in Apple was worth $203 in real terms at the end of the total 39.2-year period, a two-hundred-fold increase in inflation-adjusted terms (excluding costs and taxes) versus just $19 for the overall market. But for this gigantic final value advantage, an Apple investor had to endure gigantically higher risk pain - not just in the first two decades, but consistently and ultimately up to the present day.
It's easy to pick superstar stocks with hindsight. Almost all fund managers and private investors have mastered this common variant of stock picking. Rearview mirror stock picking delivers great returns for paper, for the regulars' table and for Internet discussion forums.
Those private investors who somehow make historic superstar returns for the Future find relevant, just like the “professionals” who like to publish these numbers in books, print articles, internet blogs and discussion forums, should, however, have the intellectual honesty to point out the brutal risk that comes with such highly concentrated individual stock investments - even, and this is the essence of this blog post, in the case of the very, very rare superstar stocks like Apple. This risk feels simply excruciating in real time, when you hold a significant portion of your wealth in such a single stock, and when the end of the curve in the right third of the graph is still unknown. (If you don't hold a significant portion of your wealth in the superstar stock, you'll see little benefit, in monetary terms, from its mega-returns.)
With “normal” stocks like Volkswagen, Nestlé, AT&T or UPS, the same brutal risk exists, but without the great superstar returns.
And because this risk feels excruciating in the long term, very, very few investors can endure it long term. The result is frequent selling, in and out, back and forth. Because this is the case, there are fewer private investors on this planet who have owned Apple shares for 39 years than lottery millionaires. And that's why superstar stock returns are like Hollywood blockbusters: maybe interesting and entertaining, but not very helpful in running your own life.
What we are describing here using Apple shares has also been shown in a much more systematic way by scientists: Only 4% of all shares are responsible for the entire market return above the “savings book interest rate”, the “risk-free return” (Bessembinder 2018 and Bessembinder et al. 2019). The other 96% “narrow-gauge stocks” collectively only generate the savings account return, which, adjusted for inflation, is close to zero. The conclusion for us is: Be smart and invest in all Shares. On the other hand, if you conclude that you have to look for and find the future 4% top performers, we wish you good luck and iron nerves. He will need both.
Will Apple shares perform better or worse than the overall market in the future? We don't have the slightest clue because short, medium and long-term price forecasts for individual stocks have the reliability of dice - combined with a wider range of results. On the other hand, if you do not invest in stocks as a game of chance, but rather as a rational form of wealth creation and retirement provision, you are better off with globally diversified index funds.
Endnotes
[1] There may be a small handful of private investors who have held Apple shares continuously for over 30 years (but probably not the full 39 years), see e.g. b. here. It is not known how reliable this information is and whether these items are of significant magnitude.
literature
Bessembinder, Hendrik (2018): “Do Stocks Outperform Treasury Bills?”; In: Journal of Financial Economics; 129; No. 3.
Bessembinder, Hendrik; Chen, Te Feng; Choi, Goeun; Wei, K. C. John (2019): “Do Global Stocks Outperform US Treasury Bills?”; Internet reference: https://papers.ssrn.com/sol3/papers.cfm?abstract_id=3415739
Kommer, Gerd; Weis, Alexander (2018): “Zero interest rates and the investment crisis – real or just constructed?”; blog post; April 2018; Internet reference: https://www.gerd-kommer-invest.de/nullzinsen-und-anlagenotstand/